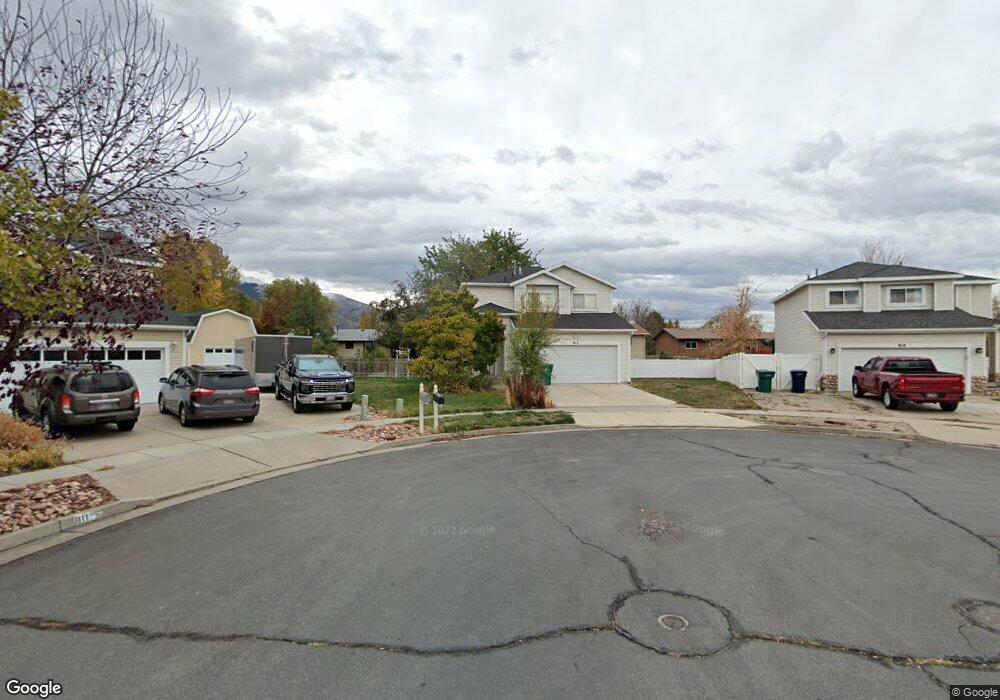
813 S 175 E Layton, UT 84041
Estimated Value: $438,000 - $476,000
3
Beds
3
Baths
1,290
Sq Ft
$350/Sq Ft
Est. Value
About This Home
This home is located at 813 S 175 E, Layton, UT 84041 and is currently estimated at $451,926, approximately $350 per square foot. 813 S 175 E is a home located in Davis County with nearby schools including Layton Elementary School, Fairfield Junior High School, and Davis High School.
Ownership History
Date
Name
Owned For
Owner Type
Purchase Details
Closed on
Jun 6, 2012
Sold by
Ross Donald E and Ross Meghan M
Bought by
Adams Douglas Leroy
Current Estimated Value
Home Financials for this Owner
Home Financials are based on the most recent Mortgage that was taken out on this home.
Original Mortgage
$151,810
Outstanding Balance
$104,885
Interest Rate
3.84%
Mortgage Type
New Conventional
Estimated Equity
$347,041
Purchase Details
Closed on
May 21, 2004
Sold by
Johnsen Jeremy Clarke and Johnsen Britnie
Bought by
Ross Donald E and Ross Meghan M
Home Financials for this Owner
Home Financials are based on the most recent Mortgage that was taken out on this home.
Original Mortgage
$123,779
Interest Rate
5.77%
Mortgage Type
FHA
Purchase Details
Closed on
Apr 7, 1999
Sold by
Kaufman & Broad Of Utah Inc
Bought by
Johnsen Jeremy Clarke and Johnsen Britnie
Create a Home Valuation Report for This Property
The Home Valuation Report is an in-depth analysis detailing your home's value as well as a comparison with similar homes in the area
Home Values in the Area
Average Home Value in this Area
Purchase History
| Date | Buyer | Sale Price | Title Company |
|---|---|---|---|
| Adams Douglas Leroy | -- | First American Title | |
| Ross Donald E | -- | Founders Title Co | |
| Johnsen Jeremy Clarke | -- | First American Title Co |
Source: Public Records
Mortgage History
| Date | Status | Borrower | Loan Amount |
|---|---|---|---|
| Open | Adams Douglas Leroy | $151,810 | |
| Previous Owner | Ross Donald E | $123,779 |
Source: Public Records
Tax History
| Year | Tax Paid | Tax Assessment Tax Assessment Total Assessment is a certain percentage of the fair market value that is determined by local assessors to be the total taxable value of land and additions on the property. | Land | Improvement |
|---|---|---|---|---|
| 2025 | $2,085 | $218,900 | $115,787 | $103,113 |
| 2024 | $1,997 | $211,200 | $128,220 | $82,980 |
| 2023 | $1,910 | $356,000 | $126,598 | $229,402 |
| 2022 | $2,092 | $211,750 | $79,358 | $132,392 |
| 2021 | $1,835 | $277,000 | $119,066 | $157,934 |
| 2020 | $1,657 | $240,000 | $100,093 | $139,907 |
| 2019 | $1,622 | $230,000 | $103,043 | $126,957 |
| 2018 | $1,545 | $220,000 | $90,338 | $129,662 |
| 2016 | $1,319 | $96,910 | $35,316 | $61,594 |
| 2015 | $1,266 | $88,275 | $35,316 | $52,959 |
| 2014 | $1,230 | $87,699 | $35,316 | $52,383 |
| 2013 | -- | $90,951 | $24,816 | $66,135 |
Source: Public Records
Map
Nearby Homes
- 810 S 175 E
- 799 S 125 E
- 282 E 925 S
- 753 S 300 E
- 389 Morgan St
- 493 E Alice Way
- 189 S Main St Unit 76
- 189 S Main St Unit 21
- 706 S 600 E
- 617 E 405 S
- 811 S Main St
- 623 E Clearwater Dr Unit 15
- 1460 W Pleasant View Dr Unit 7
- 1435 W Pleasant View Dr Unit 37
- 1439 W Pleasant View Dr Unit 35
- 1440 W Pleasant View Dr Unit 3
- 905 S Main St Unit G
- 895 S Main St Unit E
- 86 Mill Rd
- 679 S Clearwater Falls Dr
Your Personal Tour Guide
Ask me questions while you tour the home.