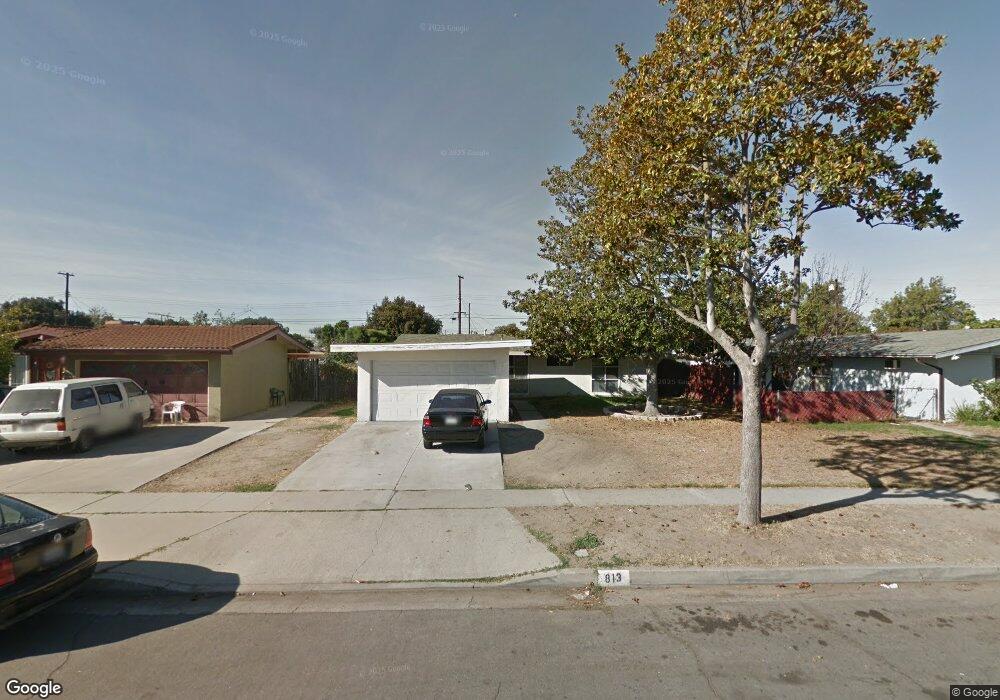
813 S Locust Dr Fullerton, CA 92833
Fullerton AreaEstimated Value: $846,000 - $914,477
About This Home
This home is located at 813 S Locust Dr, Fullerton, CA 92833 and is currently estimated at $886,869, approximately $712 per square foot. 813 S Locust Dr is a home located in Orange County with nearby schools including Pacific Drive Elementary School, Nicolas Junior High School, and Sunny Hills High School.
Ownership History
We collect this data history from publicly available records. To have your information removed, we recommend requesting removal directly through your county’s website.
Purchase Details
Home Financials for this Owner
Home Financials are based on the most recent Mortgage that was taken out on this home.Purchase Details
Purchase Details
Home Financials for this Owner
Home Financials are based on the most recent Mortgage that was taken out on this home.Purchase Details
Purchase Details
Purchase Details
Home Financials for this Owner
Home Financials are based on the most recent Mortgage that was taken out on this home.Purchase Details
Purchase Details
Purchase Details
Purchase Details
Purchase Details
Purchase Details
Purchase Details
Purchase Details
Purchase Details
Purchase History
We collect this data history from publicly available records. To have your information removed, we recommend requesting removal directly through your county’s website.
| Date | Buyer | Sale Price | Title Company |
|---|---|---|---|
| $325,000 | Lsi Title Agency Inc | ||
| $411,424 | None Available | ||
| -- | Chicago Title Co | ||
| -- | Landamerica Commonwealth Tit | ||
| -- | Landamerica Commonwealth Tit | ||
| -- | Fidelity National Title Ins | ||
| $165,000 | Fidelity National Title Ins | ||
| -- | -- | ||
| $105,000 | Landsafe Title | ||
| $90,440 | Landsafe Title | ||
| $141,500 | Gateway Title Company | ||
| $135,879 | Stewart Title | ||
| -- | -- | ||
| -- | United Title Company | ||
| -- | -- | ||
| -- | Stewart Title |
Mortgage History
We collect this data history from publicly available records. To have your information removed, we recommend requesting removal directly through your county’s website.
| Date | Status | Borrower | Loan Amount |
|---|---|---|---|
| Open | $102,019 | ||
| Open | $319,978 | ||
| Previous Owner | $390,000 | ||
| Previous Owner | $348,000 | ||
| Previous Owner | $68,562 | ||
| Previous Owner | $50,000 | ||
| Previous Owner | $230,000 | ||
| Previous Owner | $161,227 |
Tax History
We collect this data history from publicly available records. To have your information removed, we recommend requesting removal directly through your county’s website.
| Year | Tax Paid | Tax Assessment Tax Assessment Total Assessment is a certain percentage of the fair market value that is determined by local assessors to be the total taxable value of land and additions on the property. | Land | Improvement |
|---|---|---|---|---|
| 2025 | $5,167 | $444,270 | $367,052 | $77,218 |
| 2024 | $4,963 | $435,559 | $359,855 | $75,704 |
| 2023 | $4,842 | $427,019 | $352,799 | $74,220 |
| 2022 | $4,806 | $418,647 | $345,882 | $72,765 |
| 2021 | $4,722 | $410,439 | $339,100 | $71,339 |
| 2020 | $4,695 | $406,231 | $335,623 | $70,608 |
| 2019 | $4,574 | $398,266 | $329,042 | $69,224 |
| 2018 | $4,504 | $390,457 | $322,590 | $67,867 |
| 2017 | $4,428 | $382,801 | $316,264 | $66,537 |
| 2016 | $4,336 | $375,296 | $310,063 | $65,233 |
| 2015 | $4,215 | $369,659 | $305,405 | $64,254 |
| 2014 | $4,093 | $362,418 | $299,422 | $62,996 |
Map
- 1639 W Hill Ave
- 1700 W Ash Ave
- 1850 W Orangethorpe Ave Unit 81E
- 1850 W Orangethorpe Ave Unit 63
- 1850 W Orangethorpe Ave
- 1500 W Elm Ave
- 1913 W Valencia Dr
- 1467 W Flower Ave
- 313 Napa Ct
- 2100 W Valencia Dr
- 1006 S Lambert Dr
- 1884 Carol Dr
- 1879 Carol Dr
- 1001 S Gilbert St
- 1342 W Southgate Ave
- 1927 W Houston Ave Unit 5
- 1467 W Roberta Ave
- 1484 W Maxzim Ave
- 1412 W Baker Ave
- 1919 229 W Coronet Unit 229
- 812 S Brookhurst Rd
- 818 S Brookhurst Rd
- 806 S Brookhurst Rd
- 900 S Brookhurst Rd
- 800 S Brookhurst Rd
- 819 S Locust Dr
- 825 S Locust Dr
- 807 S Locust Dr
- 901 S Locust Dr
- 906 S Brookhurst Rd
- 713 S Brookhurst Rd
- 724 S Brookhurst Rd
- 719 S Brookhurst Rd
- 707 S Brookhurst Rd
- 801 S Locust Dr
- 801 S Brookhurst Rd
- 701 S Brookhurst Rd
- 907 S Locust Dr
- 912 S Brookhurst Rd
- 718 S Brookhurst Rd
Ask me questions while you tour the home.