Estimated Value: $194,704 - $205,000
3
Beds
2
Baths
1,564
Sq Ft
$127/Sq Ft
Est. Value
About This Home
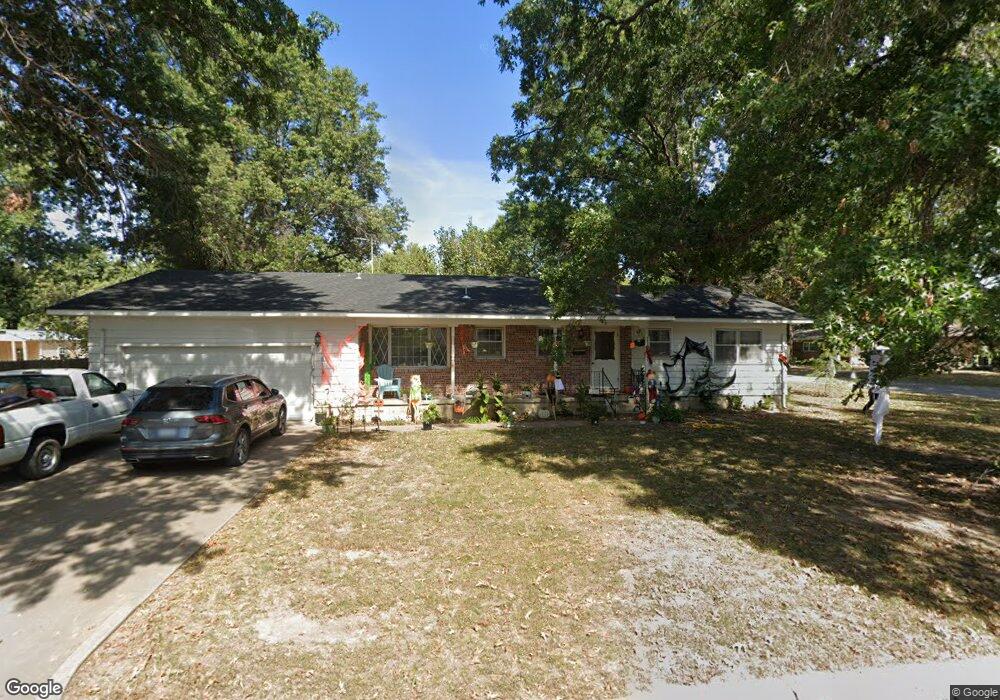
This home is located at 813 SE 15th St, Pryor, OK 74361 and is currently estimated at $198,176, approximately $126 per square foot. 813 SE 15th St is a home located in Mayes County with nearby schools including Pryor Middle School and Pryor High School.
Ownership History
Date
Name
Owned For
Owner Type
Purchase Details
Closed on
Jul 31, 2015
Sold by
Vanhorn Kristen Dawn
Bought by
Vanhorn Dustin Ralph
Current Estimated Value
Purchase Details
Closed on
Dec 31, 2009
Sold by
Carpenter Stephanie and Sixkiller Stephanie
Bought by
Vanhorn Dustin R and Graham Kristen D
Home Financials for this Owner
Home Financials are based on the most recent Mortgage that was taken out on this home.
Original Mortgage
$104,448
Outstanding Balance
$67,636
Interest Rate
4.76%
Mortgage Type
New Conventional
Estimated Equity
$130,540
Purchase Details
Closed on
Nov 16, 2007
Sold by
Dale Maxine
Bought by
Sixkiller Stephanie
Home Financials for this Owner
Home Financials are based on the most recent Mortgage that was taken out on this home.
Original Mortgage
$86,500
Interest Rate
6.27%
Mortgage Type
New Conventional
Purchase Details
Closed on
Dec 12, 2003
Sold by
Peper Victor Trustee For
Bought by
Dale Maxine
Create a Home Valuation Report for This Property
The Home Valuation Report is an in-depth analysis detailing your home's value as well as a comparison with similar homes in the area
Purchase History
| Date | Buyer | Sale Price | Title Company |
|---|---|---|---|
| Vanhorn Dustin Ralph | -- | None Available | |
| Vanhorn Dustin R | $102,500 | None Available | |
| Sixkiller Stephanie | $86,500 | None Available | |
| Dale Maxine | $67,500 | -- |
Source: Public Records
Mortgage History
| Date | Status | Borrower | Loan Amount |
|---|---|---|---|
| Open | Vanhorn Dustin R | $104,448 | |
| Previous Owner | Sixkiller Stephanie | $86,500 |
Source: Public Records
Tax History
| Year | Tax Paid | Tax Assessment Tax Assessment Total Assessment is a certain percentage of the fair market value that is determined by local assessors to be the total taxable value of land and additions on the property. | Land | Improvement |
|---|---|---|---|---|
| 2025 | $1,146 | $14,572 | $3,122 | $11,450 |
| 2024 | $1,110 | $14,146 | $3,031 | $11,115 |
| 2023 | $1,110 | $13,735 | $2,950 | $10,785 |
| 2022 | $1,031 | $13,335 | $2,869 | $10,466 |
| 2021 | $1,008 | $12,946 | $2,763 | $10,183 |
| 2020 | $958 | $12,570 | $2,682 | $9,888 |
| 2019 | $957 | $12,204 | $2,682 | $9,522 |
| 2018 | $921 | $11,848 | $2,682 | $9,166 |
| 2017 | $829 | $11,503 | $2,682 | $8,821 |
| 2016 | $828 | $11,389 | $1,331 | $10,058 |
| 2015 | $842 | $11,389 | $1,331 | $10,058 |
| 2014 | $842 | $11,389 | $1,331 | $10,058 |
Source: Public Records
Map
Nearby Homes
- 1408 Veyda St
- 1200 SE 15th St
- 1220 SE 14th St
- 1912 Brookfield Terrace
- 336 SE 16th St
- 1001 Colonial Dr
- 1601 Merlin Cir
- 520 Ridgewood Dr
- 2770 Summerfield Place
- 1749 Southridge Dr
- 1215 Lyndsey Ln
- 1120 Cottonwood Ct
- 315 Savannah Park
- 837 S Wood St
- 831 S Wood St
- 811 S Wood St
- 805 S Wood St
- 215 S Elliott St
- 514 S Vann St
- 1230 SE 2nd Ct
- 809 SE 15th St
- 814 SE 14th St
- 808 SE 14th St
- 812 SE 15th St
- 1405 Karen Ave
- 808 SE 15th St
- 816 SE 15th St
- 1409 Karen Ave
- 1401 Karen Ave
- 805 SE 15th St
- 804 SE 14th St
- 804 SE 15th St
- 813 SE 14th St
- 1404 Lahoma Dr
- 809 SE 14th St
- 1309 Karen Ave
- 1408 Lahoma Dr
- 1404 Lahoma St
- 1409 S Elliott St
- 904 SE 14th St
Your Personal Tour Guide
Ask me questions while you tour the home.