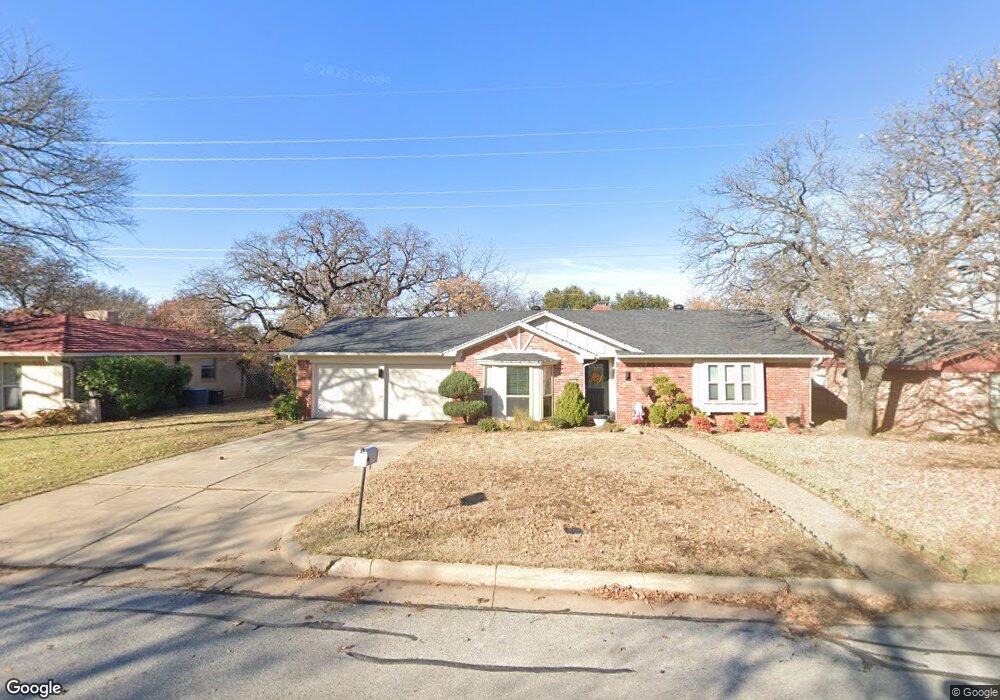
813 Spring Brook Dr Bedford, TX 76021
Estimated Value: $286,000 - $375,000
3
Beds
2
Baths
1,733
Sq Ft
$192/Sq Ft
Est. Value
About This Home
This home is located at 813 Spring Brook Dr, Bedford, TX 76021 and is currently estimated at $332,623, approximately $191 per square foot. 813 Spring Brook Dr is a home located in Tarrant County with nearby schools including Shady Brook Elementary School, Bedford Junior High School, and L.D. Bell High School.
Ownership History
Date
Name
Owned For
Owner Type
Purchase Details
Closed on
Aug 28, 2012
Sold by
Intex Homes 2 Lp
Bought by
Bowland Erin Rene and Bowland Benjamin Michael
Current Estimated Value
Home Financials for this Owner
Home Financials are based on the most recent Mortgage that was taken out on this home.
Original Mortgage
$125,681
Outstanding Balance
$86,678
Interest Rate
3.5%
Mortgage Type
FHA
Estimated Equity
$245,945
Purchase Details
Closed on
Apr 25, 2012
Sold by
Federal National Mortgage Association
Bought by
Intex Homes 2 Lp
Home Financials for this Owner
Home Financials are based on the most recent Mortgage that was taken out on this home.
Original Mortgage
$89,460
Interest Rate
3.9%
Mortgage Type
Purchase Money Mortgage
Purchase Details
Closed on
Jun 7, 2011
Sold by
Coley Lillian Mildred
Bought by
Federal National Mortgage Association and Fannie Mae
Purchase Details
Closed on
Feb 3, 2003
Sold by
Estate Of William Mordacai Coley Jr
Bought by
Coley Lillian Mildred
Create a Home Valuation Report for This Property
The Home Valuation Report is an in-depth analysis detailing your home's value as well as a comparison with similar homes in the area
Home Values in the Area
Average Home Value in this Area
Purchase History
| Date | Buyer | Sale Price | Title Company |
|---|---|---|---|
| Bowland Erin Rene | -- | None Available | |
| Bowland Erin Rene | -- | None Available | |
| Intex Homes 2 Lp | -- | None Available | |
| Federal National Mortgage Association | $120,000 | None Available | |
| Coley Lillian Mildred | -- | -- |
Source: Public Records
Mortgage History
| Date | Status | Borrower | Loan Amount |
|---|---|---|---|
| Open | Bowland Erin Rene | $125,681 | |
| Closed | Bowland Erin Rene | $125,681 | |
| Previous Owner | Intex Homes 2 Lp | $89,460 |
Source: Public Records
Tax History Compared to Growth
Tax History
| Year | Tax Paid | Tax Assessment Tax Assessment Total Assessment is a certain percentage of the fair market value that is determined by local assessors to be the total taxable value of land and additions on the property. | Land | Improvement |
|---|---|---|---|---|
| 2025 | $3,809 | $258,016 | $65,000 | $193,016 |
| 2024 | $3,809 | $258,016 | $65,000 | $193,016 |
| 2023 | $4,598 | $264,084 | $40,000 | $224,084 |
| 2022 | $4,760 | $217,916 | $40,000 | $177,916 |
| 2021 | $5,008 | $212,596 | $40,000 | $172,596 |
| 2020 | $5,288 | $222,820 | $40,000 | $182,820 |
| 2019 | $4,912 | $212,835 | $40,000 | $172,835 |
| 2018 | $4,084 | $183,811 | $40,000 | $143,811 |
| 2017 | $4,042 | $187,629 | $25,000 | $162,629 |
| 2016 | $3,675 | $170,372 | $25,000 | $145,372 |
| 2015 | $3,468 | $138,100 | $17,000 | $121,100 |
| 2014 | $3,468 | $138,100 | $17,000 | $121,100 |
Source: Public Records
Map
Nearby Homes
- 817 Shady Lake Dr
- 801 Shady Creek Ln
- 922 Shady Creek Ln
- 2436 Brookgreen Ct
- 1740 Brown Trail
- 3119 Spring Grove Dr
- 432 Sunnybrook Ct
- 2420 Stonegate Dr N
- 1013 Springdale Rd
- 3213 Spring Valley Dr
- 2501 Shady Grove Dr
- 2700 Shady Grove Dr
- 2704 Shady Grove Dr
- 2317 Shady Grove Dr
- 2225 Shady Brook Dr
- 2508 Lakeview Dr
- 1732 Jeannie Ln
- 913 Kensington Ct
- 124 Jeannie Ct
- 121 Kay Ct
- 817 Spring Brook Dr
- 809 Spring Brook Dr
- 821 Spring Brook Dr
- 812 Springdale Rd
- 808 Springdale Rd
- 816 Springdale Rd
- 804 Springdale Rd
- 812 Spring Brook Dr
- 808 Spring Brook Dr
- 801 Spring Brook Dr
- 825 Spring Brook Dr
- 820 Springdale Rd
- 816 Spring Brook Dr
- 804 Spring Brook Dr
- 800 Springdale Rd
- 820 Spring Brook Dr
- 2608 Summit View Dr
- 824 Springdale Rd
- 829 Spring Brook Dr
- 809 San Marcos Ln