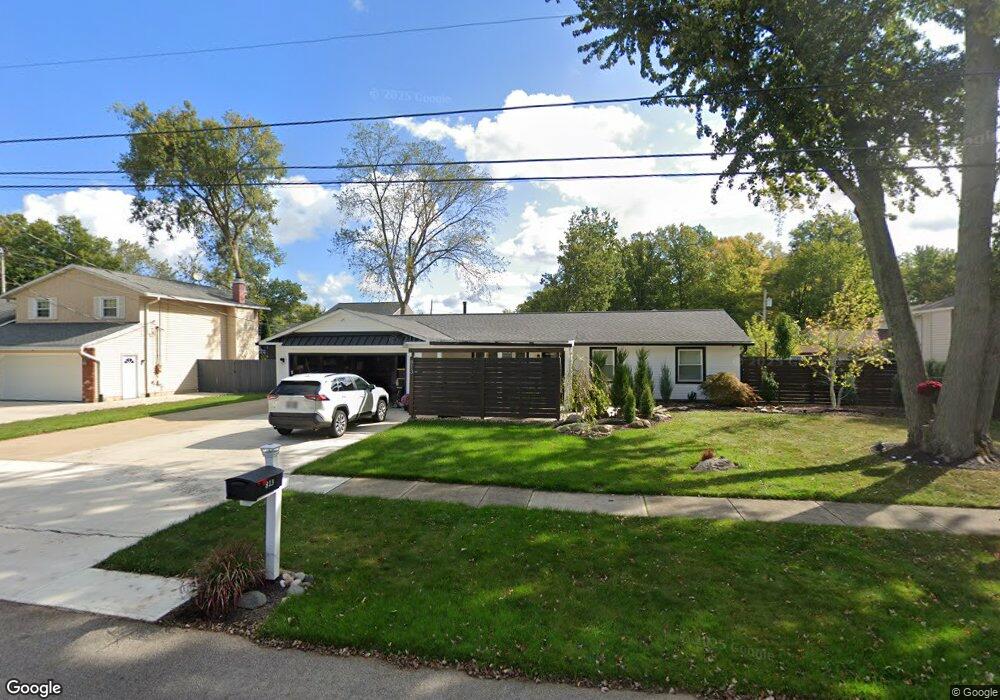
813 Sunset Ave Sheffield Lake, OH 44054
Estimated Value: $216,000 - $240,000
3
Beds
2
Baths
1,520
Sq Ft
$153/Sq Ft
Est. Value
About This Home
This home is located at 813 Sunset Ave, Sheffield Lake, OH 44054 and is currently estimated at $232,113, approximately $152 per square foot. 813 Sunset Ave is a home located in Lorain County with nearby schools including Knollwood Elementary School, Brookside Intermediate School, and Brookside Middle School.
Ownership History
Date
Name
Owned For
Owner Type
Purchase Details
Closed on
Jun 15, 2006
Sold by
Schuster Andrew J and Schuster Rita C
Bought by
Schuster Andrew J and Schuster Rita C
Current Estimated Value
Home Financials for this Owner
Home Financials are based on the most recent Mortgage that was taken out on this home.
Original Mortgage
$133,726
Outstanding Balance
$78,259
Interest Rate
6.68%
Mortgage Type
FHA
Estimated Equity
$153,854
Purchase Details
Closed on
Apr 11, 2000
Sold by
Travelers Home Mtg Services Inc
Bought by
Schuster Andrew J
Home Financials for this Owner
Home Financials are based on the most recent Mortgage that was taken out on this home.
Original Mortgage
$91,788
Interest Rate
8.22%
Mortgage Type
FHA
Purchase Details
Closed on
Nov 29, 1999
Sold by
Devine James W Kathleen J
Bought by
Travelers Home Mtg Services Inc
Create a Home Valuation Report for This Property
The Home Valuation Report is an in-depth analysis detailing your home's value as well as a comparison with similar homes in the area
Home Values in the Area
Average Home Value in this Area
Purchase History
| Date | Buyer | Sale Price | Title Company |
|---|---|---|---|
| Schuster Andrew J | -- | Sandstone Title Agency Ltd | |
| Schuster Andrew J | $93,000 | Lorain County Title Co Inc | |
| Travelers Home Mtg Services Inc | $74,000 | General Title Agency Inc |
Source: Public Records
Mortgage History
| Date | Status | Borrower | Loan Amount |
|---|---|---|---|
| Open | Schuster Andrew J | $133,726 | |
| Closed | Schuster Andrew J | $91,788 |
Source: Public Records
Tax History Compared to Growth
Tax History
| Year | Tax Paid | Tax Assessment Tax Assessment Total Assessment is a certain percentage of the fair market value that is determined by local assessors to be the total taxable value of land and additions on the property. | Land | Improvement |
|---|---|---|---|---|
| 2024 | $3,248 | $60,897 | $11,466 | $49,431 |
| 2023 | $2,653 | $43,712 | $11,956 | $31,756 |
| 2022 | $2,628 | $43,712 | $11,956 | $31,756 |
| 2021 | $2,643 | $43,712 | $11,956 | $31,756 |
| 2020 | $2,463 | $37,260 | $10,190 | $27,070 |
| 2019 | $2,449 | $37,260 | $10,190 | $27,070 |
| 2018 | $2,478 | $37,260 | $10,190 | $27,070 |
| 2017 | $2,498 | $34,530 | $4,330 | $30,200 |
| 2016 | $2,521 | $34,530 | $4,330 | $30,200 |
| 2015 | $2,489 | $34,530 | $4,330 | $30,200 |
| 2014 | $2,199 | $33,520 | $4,200 | $29,320 |
| 2013 | $2,189 | $33,520 | $4,200 | $29,320 |
Source: Public Records
Map
Nearby Homes
- 738 W Shore Blvd
- 762 Maplewood Ave
- VL Maplewood Ave
- 0 Kenilworth Ave
- 737 Dunny Ave
- 644 Pasadena Ave
- 640 Pasadena Ave
- 662 Kenilworth Ave
- 580 Alameda Ave
- 646 Dunny Ave
- 4272 Brockley Ave
- 689 Lafayette Blvd
- 4260 Brockley Ave
- 4283 Holl Ave
- 4286 Holl Ave
- 0 E Lake Rd
- 630 Treadway Blvd
- 4502 Edgewater Dr
- 4154 Belle Ave
- 552 Treadway Blvd
- 805 Sunset Ave
- 823 Sunset Ave
- 816 Alameda Ave
- 826 Alameda Ave
- 806 Alameda Ave
- 812 Sunset Ave
- 822 Sunset Ave
- 806 Sunset Ave
- 833 Sunset Ave
- 834 Alameda Ave
- 830 Sunset Ave
- 785 Sunset Ave
- 790 Alameda Ave
- 815 Pasadena Ave
- 815 Alameda Ave
- 836 Sunset Ave
- 841 Sunset Ave
- 786 Sunset Ave
- 825 Pasadena Ave
- 825 Alameda Ave