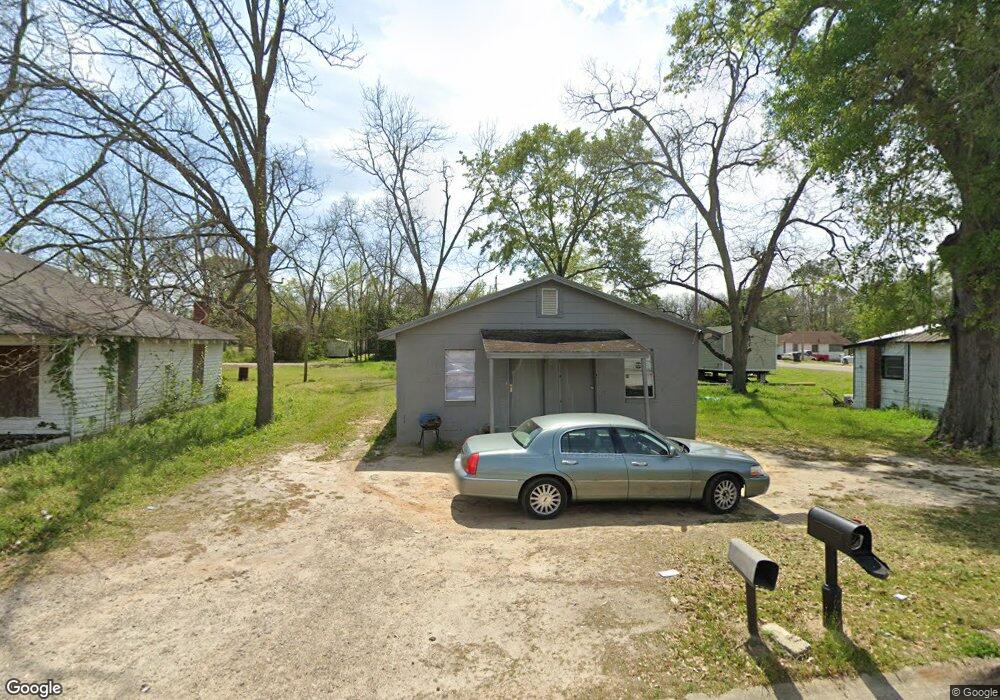
813 W 17th Ave Cordele, GA 31015
Estimated Value: $42,000 - $345,000
4
Beds
2
Baths
1,404
Sq Ft
$100/Sq Ft
Est. Value
About This Home
This home is located at 813 W 17th Ave, Cordele, GA 31015 and is currently estimated at $140,748, approximately $100 per square foot. 813 W 17th Ave is a home located in Crisp County with nearby schools including Crisp County Elementary School, Crisp County Primary School, and Crisp County Middle School.
Ownership History
Date
Name
Owned For
Owner Type
Purchase Details
Closed on
Dec 15, 2023
Sold by
Turton Investments
Bought by
Akw Properties Llc
Current Estimated Value
Home Financials for this Owner
Home Financials are based on the most recent Mortgage that was taken out on this home.
Original Mortgage
$16,988
Outstanding Balance
$12,773
Interest Rate
7.29%
Mortgage Type
New Conventional
Estimated Equity
$127,975
Purchase Details
Closed on
Jan 24, 1984
Bought by
Turton Investments
Purchase Details
Closed on
Jan 4, 1984
Bought by
Turton Investments
Purchase Details
Closed on
Dec 2, 1981
Bought by
Forrester Doris M
Create a Home Valuation Report for This Property
The Home Valuation Report is an in-depth analysis detailing your home's value as well as a comparison with similar homes in the area
Home Values in the Area
Average Home Value in this Area
Purchase History
| Date | Buyer | Sale Price | Title Company |
|---|---|---|---|
| Akw Properties Llc | $24,000 | -- | |
| Turton Investments | $1,800 | -- | |
| Turton Investments | -- | -- | |
| Forrester Doris M | -- | -- |
Source: Public Records
Mortgage History
| Date | Status | Borrower | Loan Amount |
|---|---|---|---|
| Open | Akw Properties Llc | $16,988 |
Source: Public Records
Tax History Compared to Growth
Tax History
| Year | Tax Paid | Tax Assessment Tax Assessment Total Assessment is a certain percentage of the fair market value that is determined by local assessors to be the total taxable value of land and additions on the property. | Land | Improvement |
|---|---|---|---|---|
| 2024 | $598 | $16,689 | $833 | $15,856 |
| 2023 | $593 | $15,813 | $833 | $14,980 |
| 2022 | $395 | $14,938 | $833 | $14,105 |
| 2021 | $387 | $14,062 | $833 | $13,229 |
| 2020 | $396 | $14,062 | $833 | $13,229 |
| 2019 | $399 | $14,062 | $833 | $13,229 |
| 2018 | $383 | $13,010 | $1,250 | $11,760 |
| 2017 | $418 | $10,290 | $1,250 | $9,040 |
| 2016 | $304 | $10,290 | $1,250 | $9,040 |
| 2015 | -- | $10,290 | $1,250 | $9,040 |
| 2014 | -- | $10,290 | $1,250 | $9,040 |
| 2013 | -- | $10,290 | $1,250 | $9,040 |
Source: Public Records
Map
Nearby Homes