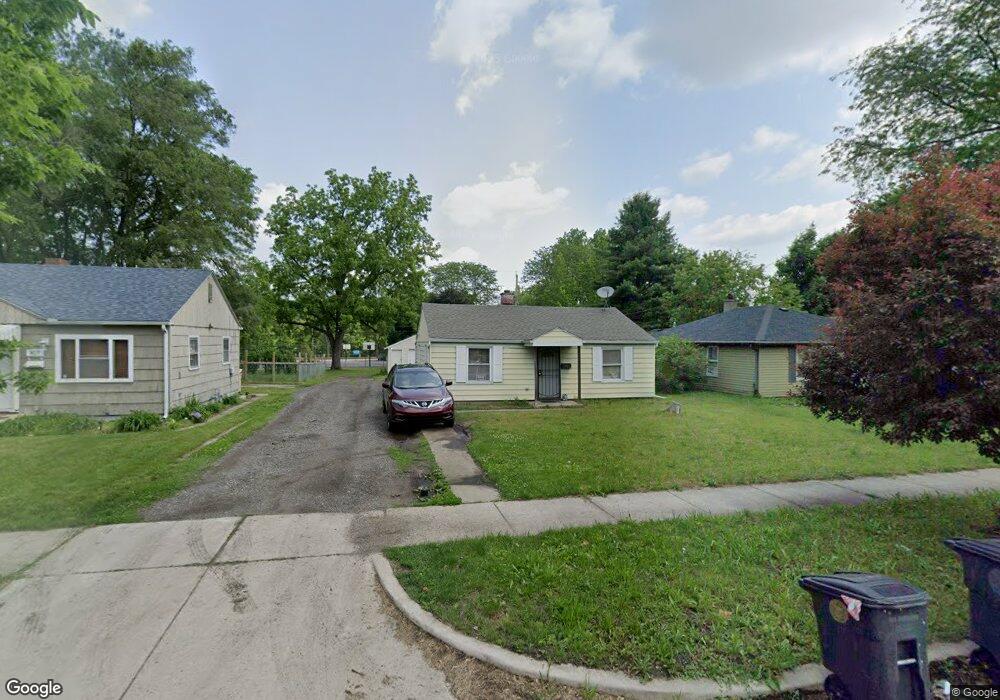
813 W Bryan St South Bend, IN 46616
Keller Park NeighborhoodEstimated Value: $81,173 - $116,000
2
Beds
1
Bath
720
Sq Ft
$134/Sq Ft
Est. Value
About This Home
This home is located at 813 W Bryan St, South Bend, IN 46616 and is currently estimated at $96,293, approximately $133 per square foot. 813 W Bryan St is a home located in St. Joseph County with nearby schools including Muessel Primary Center, Clay Intermediate Center, and Jefferson Intermediate Traditional School.
Ownership History
Date
Name
Owned For
Owner Type
Purchase Details
Closed on
Jun 30, 2020
Sold by
Preferred Trust Company
Bought by
Preferred Trust Company and Larry Bradburn 414300365
Current Estimated Value
Purchase Details
Closed on
Feb 21, 2020
Sold by
Preferred Trust Company
Bought by
Preferred Trust Company and Larry Bradburn 414300365
Purchase Details
Closed on
Mar 26, 2014
Sold by
Bradley Management Llc
Bought by
Preferred Trust Co
Purchase Details
Closed on
Apr 14, 2013
Sold by
Dhf Properties Llc
Bought by
Bradley Management Llc
Purchase Details
Closed on
Nov 24, 2009
Sold by
Woolley Daniel J and Woolley Clara V
Bought by
Dhf Properties Llc
Create a Home Valuation Report for This Property
The Home Valuation Report is an in-depth analysis detailing your home's value as well as a comparison with similar homes in the area
Home Values in the Area
Average Home Value in this Area
Purchase History
| Date | Buyer | Sale Price | Title Company |
|---|---|---|---|
| Preferred Trust Company | -- | None Listed On Document | |
| Preferred Trust Company | -- | -- | |
| Preferred Trust Co | -- | Fidelity National Title | |
| Bradley Management Llc | -- | -- | |
| Dhf Properties Llc | -- | None Available |
Source: Public Records
Tax History Compared to Growth
Tax History
| Year | Tax Paid | Tax Assessment Tax Assessment Total Assessment is a certain percentage of the fair market value that is determined by local assessors to be the total taxable value of land and additions on the property. | Land | Improvement |
|---|---|---|---|---|
| 2024 | $1,009 | $40,300 | $5,800 | $34,500 |
| 2023 | $605 | $40,500 | $5,800 | $34,700 |
| 2022 | $605 | $25,200 | $5,800 | $19,400 |
| 2021 | $679 | $26,500 | $8,900 | $17,600 |
| 2020 | $679 | $26,500 | $8,900 | $17,600 |
| 2019 | $561 | $25,900 | $8,300 | $17,600 |
| 2018 | $688 | $27,000 | $8,300 | $18,700 |
| 2017 | $712 | $26,900 | $8,300 | $18,600 |
| 2016 | $727 | $26,900 | $8,300 | $18,600 |
| 2014 | $1,043 | $39,900 | $8,300 | $31,600 |
| 2013 | $1,045 | $39,900 | $8,300 | $31,600 |
Source: Public Records
Map
Nearby Homes
- 1815 Sherman Ave
- 248 W Beale St
- 1029 W Bryan St
- 1113 Beale St
- 1105 Queen St
- 1428 Marigold Way Unit 111
- 1922 Berkley Place
- 2106 Hollywood Place
- 1308 Kinyon St
- 1958 Berkley Place
- 2210 Inglewood Place
- 1253 Diamond Ave
- 2237 Hollywood Place
- 1201 Allen St
- 1649 N Adams St
- 1645 N Adams St
- 1710 College St
- 1116 Allen St
- 1838 N Brookfield St
- 1069 Riverside Dr