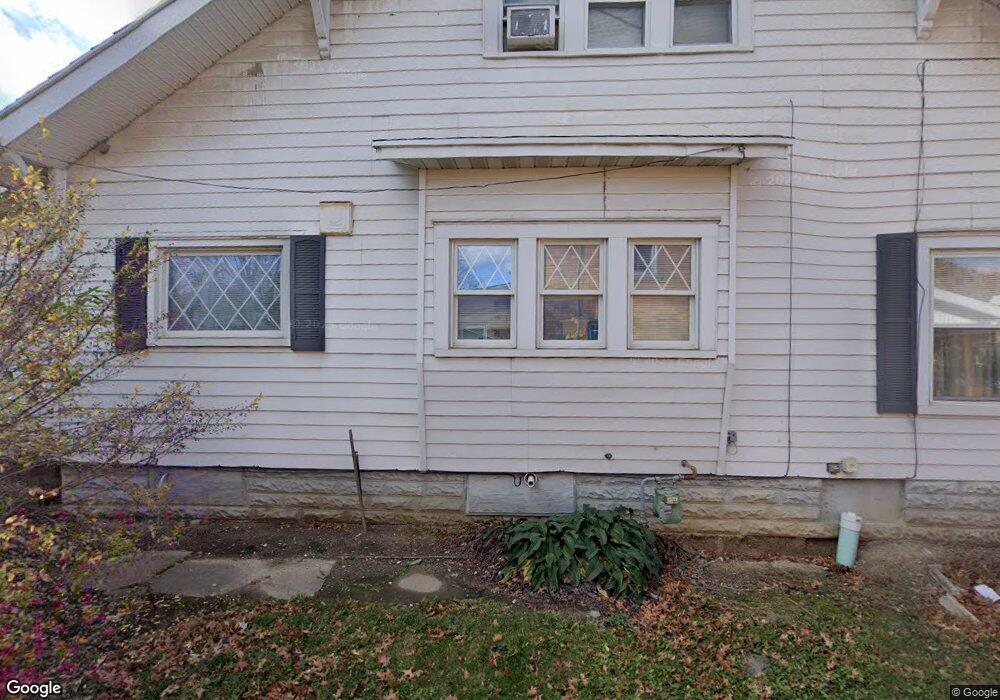
813 W Elm St Lima, OH 45805
Riverside North NeighborhoodEstimated Value: $76,000 - $99,000
3
Beds
1
Bath
2,170
Sq Ft
$38/Sq Ft
Est. Value
About This Home
This home is located at 813 W Elm St, Lima, OH 45805 and is currently estimated at $83,027, approximately $38 per square foot. 813 W Elm St is a home located in Allen County with nearby schools including Heritage Elementary School, Lima North Middle School, and Lima West Middle School.
Ownership History
Date
Name
Owned For
Owner Type
Purchase Details
Closed on
Sep 8, 2020
Sold by
Parlette Shawn Todd
Bought by
Parlette Christina Ann
Current Estimated Value
Purchase Details
Closed on
Sep 11, 2014
Sold by
Rowe Joanna J
Bought by
Parlette Shawn Todd and Parlette Christina Ann
Purchase Details
Closed on
Jul 29, 2014
Sold by
Rader Jean and Parlette Emma Jean
Bought by
Rowe Joanna J
Purchase Details
Closed on
Mar 1, 1983
Bought by
Parlette Emma Jean
Create a Home Valuation Report for This Property
The Home Valuation Report is an in-depth analysis detailing your home's value as well as a comparison with similar homes in the area
Home Values in the Area
Average Home Value in this Area
Purchase History
| Date | Buyer | Sale Price | Title Company |
|---|---|---|---|
| Parlette Christina Ann | -- | None Available | |
| Parlette Shawn Todd | $29,000 | None Available | |
| Rowe Joanna J | -- | None Available | |
| Parlette Emma Jean | -- | -- |
Source: Public Records
Tax History
| Year | Tax Paid | Tax Assessment Tax Assessment Total Assessment is a certain percentage of the fair market value that is determined by local assessors to be the total taxable value of land and additions on the property. | Land | Improvement |
|---|---|---|---|---|
| 2024 | $775 | $20,800 | $3,470 | $17,330 |
| 2023 | $837 | $19,780 | $3,290 | $16,490 |
| 2022 | $841 | $19,780 | $3,290 | $16,490 |
| 2021 | $891 | $19,780 | $3,290 | $16,490 |
| 2020 | $1,057 | $21,040 | $3,190 | $17,850 |
| 2019 | $1,057 | $21,040 | $3,190 | $17,850 |
| 2018 | $1,045 | $21,040 | $3,190 | $17,850 |
| 2017 | $1,061 | $21,040 | $3,190 | $17,850 |
| 2016 | $1,075 | $21,040 | $3,190 | $17,850 |
| 2015 | $1,008 | $21,040 | $3,190 | $17,850 |
| 2014 | $1,008 | $19,330 | $3,260 | $16,070 |
| 2013 | $991 | $19,540 | $3,260 | $16,280 |
Source: Public Records
Map
Nearby Homes
- 411 S Collett St
- 932 Faurot Ave
- 705 W Elm St
- 210 S Baxter St
- 426 S Baxter St
- 852 Faurot Ave
- 846 Faurot Ave
- 325 Nye St
- 233 S Kenilworth Ave
- 430 S Kenilworth Ave
- 419 S Atlantic Ave
- 417 S McDonel St
- 774 W Wayne St
- 1023 Brice Ave
- 753 Brice Ave
- 1027 Brice Ave
- 508 N Collett St
- 503 N Charles St
- 735 Brice Ave
- 513 N Charles St
Your Personal Tour Guide
Ask me questions while you tour the home.