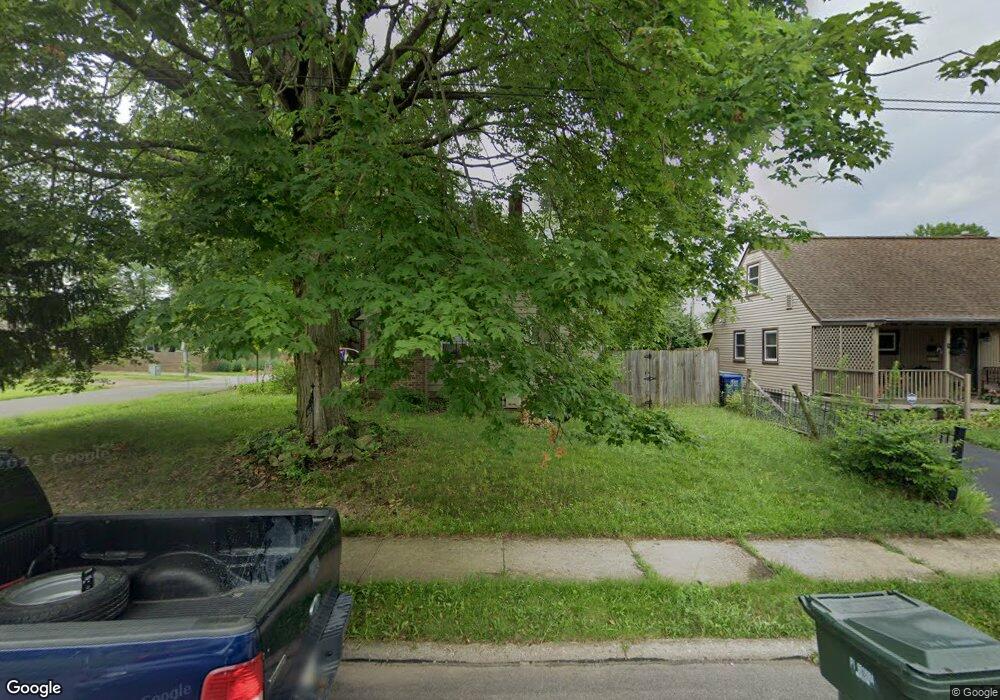
813 Weldon Ave Columbus, OH 43224
North Linden NeighborhoodEstimated Value: $196,085 - $229,000
3
Beds
3
Baths
1,044
Sq Ft
$203/Sq Ft
Est. Value
About This Home
This home is located at 813 Weldon Ave, Columbus, OH 43224 and is currently estimated at $211,521, approximately $202 per square foot. 813 Weldon Ave is a home located in Franklin County with nearby schools including Como Elementary School, Dominion Middle School, and Whetstone High School.
Ownership History
Date
Name
Owned For
Owner Type
Purchase Details
Closed on
Feb 15, 2008
Sold by
Crockett Eugene and Crockett Hettie M
Bought by
Maro Jenny
Current Estimated Value
Home Financials for this Owner
Home Financials are based on the most recent Mortgage that was taken out on this home.
Original Mortgage
$77,300
Interest Rate
6.32%
Mortgage Type
Purchase Money Mortgage
Purchase Details
Closed on
Jul 24, 2007
Sold by
Citimortgage Inc
Bought by
Salisbury Lawrence and Crockett Eugene
Purchase Details
Closed on
Jan 11, 2007
Sold by
Mason Ronnie and Case #01Cve10 10154
Bought by
Citifinancial Mortgage Co Inc and Associates Home Equity Services Inc
Purchase Details
Closed on
Mar 18, 1994
Bought by
Mason Ronnie and Mason Michele
Purchase Details
Closed on
Oct 29, 1990
Purchase Details
Closed on
Feb 27, 1990
Create a Home Valuation Report for This Property
The Home Valuation Report is an in-depth analysis detailing your home's value as well as a comparison with similar homes in the area
Home Values in the Area
Average Home Value in this Area
Purchase History
| Date | Buyer | Sale Price | Title Company |
|---|---|---|---|
| Maro Jenny | $77,300 | Hsi Title Services Inc | |
| Salisbury Lawrence | $52,000 | Chicago Title | |
| Citifinancial Mortgage Co Inc | $60,000 | None Available | |
| Mason Ronnie | $64,800 | -- | |
| -- | -- | -- | |
| -- | -- | -- |
Source: Public Records
Mortgage History
| Date | Status | Borrower | Loan Amount |
|---|---|---|---|
| Previous Owner | Maro Jenny | $77,300 |
Source: Public Records
Tax History
| Year | Tax Paid | Tax Assessment Tax Assessment Total Assessment is a certain percentage of the fair market value that is determined by local assessors to be the total taxable value of land and additions on the property. | Land | Improvement |
|---|---|---|---|---|
| 2025 | $2,669 | $59,470 | $16,310 | $43,160 |
| 2024 | $2,669 | $59,470 | $16,310 | $43,160 |
| 2023 | $2,635 | $59,465 | $16,310 | $43,155 |
| 2022 | $1,491 | $28,740 | $6,760 | $21,980 |
| 2021 | $1,493 | $28,740 | $6,760 | $21,980 |
| 2020 | $1,495 | $28,740 | $6,760 | $21,980 |
| 2019 | $1,593 | $26,260 | $5,640 | $20,620 |
| 2018 | $1,473 | $26,260 | $5,640 | $20,620 |
| 2017 | $1,755 | $28,950 | $5,640 | $23,310 |
| 2016 | $1,494 | $22,550 | $4,100 | $18,450 |
| 2015 | $1,356 | $22,550 | $4,100 | $18,450 |
| 2014 | $1,359 | $22,550 | $4,100 | $18,450 |
| 2013 | $745 | $25,060 | $4,550 | $20,510 |
Source: Public Records
Map
Nearby Homes
- 3035 Audubon Rd
- 816 Melrose Ave
- 773 Melrose Ave
- 796 E Kenworth Rd
- 978 E North Broadway St
- 983 Mohican Ave
- 964 E Weber Rd
- 2805 Beulah Rd
- 555 E Weber Rd
- 2992 Howey Rd
- 1104 E North Broadway St
- 521 Melrose Ave
- 2888 Howey Rd
- 3081 Grasmere Ave
- 580 Crestview Rd
- 2872 Howey Rd
- 2752 Azelda St
- 2950 Grasmere Ave
- 3147 Grasmere Ave
- 2733 Beulah Rd
- 807 Weldon Ave
- 801 Weldon Ave
- 808 E Longview Ave
- 825 Weldon Ave
- 802 E Longview Ave
- 816 Weldon Ave
- 796 E Longview Ave
- 795 Weldon Ave
- 822 E Longview Ave
- 810 Weldon Ave
- 833 Weldon Ave
- 804 Weldon Ave
- 828 Weldon Ave
- 790 E Longview Ave
- 828 E Longview Ave
- 789 Weldon Ave
- 798 Weldon Ave
- 839 Weldon Ave
- 834 Weldon Ave
- 784 E Longview Ave
Your Personal Tour Guide
Ask me questions while you tour the home.