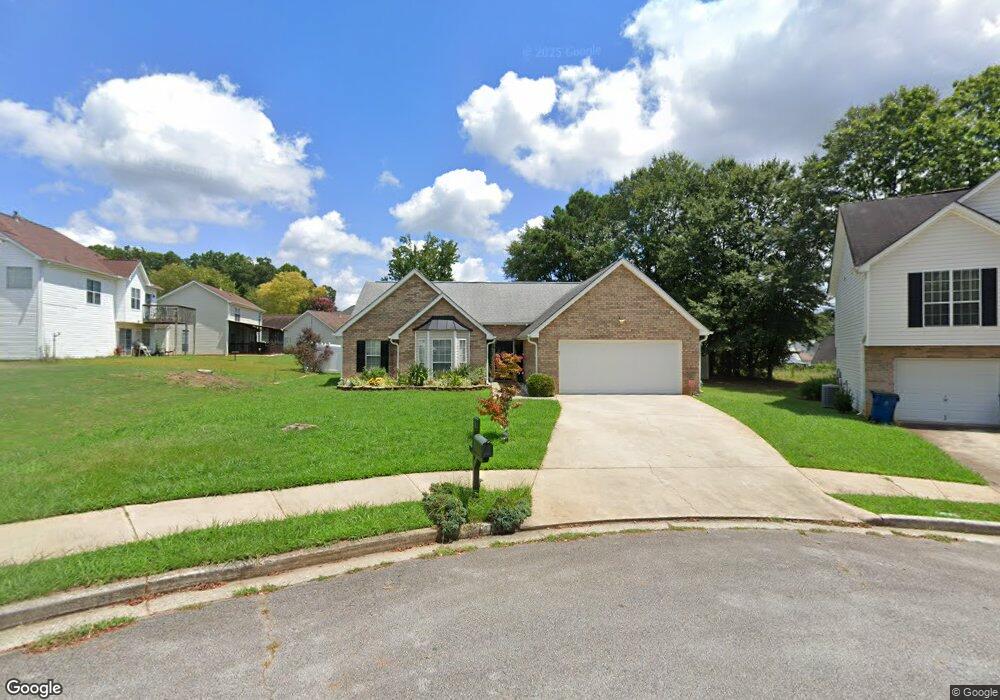
8130 S Oak Ct Unit 3 Riverdale, GA 30274
Estimated Value: $216,000 - $315,000
3
Beds
2
Baths
1,676
Sq Ft
$151/Sq Ft
Est. Value
About This Home
This home is located at 8130 S Oak Ct Unit 3, Riverdale, GA 30274 and is currently estimated at $252,620, approximately $150 per square foot. 8130 S Oak Ct Unit 3 is a home located in Clayton County with nearby schools including Callaway Elementary School, Kendrick Middle School, and Riverdale High School.
Ownership History
Date
Name
Owned For
Owner Type
Purchase Details
Closed on
Sep 22, 2011
Sold by
Collier Parrish T
Bought by
Brown Josephine E
Current Estimated Value
Home Financials for this Owner
Home Financials are based on the most recent Mortgage that was taken out on this home.
Original Mortgage
$55,555
Outstanding Balance
$38,202
Interest Rate
4.5%
Mortgage Type
FHA
Estimated Equity
$214,418
Purchase Details
Closed on
Nov 1, 2005
Sold by
Henning Shirley J
Bought by
Collier Parrish T
Home Financials for this Owner
Home Financials are based on the most recent Mortgage that was taken out on this home.
Original Mortgage
$112,000
Interest Rate
7%
Mortgage Type
New Conventional
Purchase Details
Closed on
Jan 19, 2001
Sold by
Koppar Corp
Bought by
Henning Shirleyy J
Home Financials for this Owner
Home Financials are based on the most recent Mortgage that was taken out on this home.
Original Mortgage
$110,399
Interest Rate
7.18%
Mortgage Type
FHA
Create a Home Valuation Report for This Property
The Home Valuation Report is an in-depth analysis detailing your home's value as well as a comparison with similar homes in the area
Home Values in the Area
Average Home Value in this Area
Purchase History
| Date | Buyer | Sale Price | Title Company |
|---|---|---|---|
| Brown Josephine E | $57,000 | -- | |
| Collier Parrish T | $140,000 | -- | |
| Henning Shirleyy J | $112,200 | -- |
Source: Public Records
Mortgage History
| Date | Status | Borrower | Loan Amount |
|---|---|---|---|
| Open | Brown Josephine E | $55,555 | |
| Previous Owner | Collier Parrish T | $112,000 | |
| Previous Owner | Henning Shirleyy J | $110,399 |
Source: Public Records
Tax History Compared to Growth
Tax History
| Year | Tax Paid | Tax Assessment Tax Assessment Total Assessment is a certain percentage of the fair market value that is determined by local assessors to be the total taxable value of land and additions on the property. | Land | Improvement |
|---|---|---|---|---|
| 2025 | $1,685 | $104,120 | $8,000 | $96,120 |
| 2024 | $1,507 | $91,640 | $8,000 | $83,640 |
| 2023 | $771 | $94,400 | $8,000 | $86,400 |
| 2022 | $801 | $69,280 | $8,000 | $61,280 |
| 2021 | $616 | $55,760 | $8,000 | $47,760 |
| 2020 | $587 | $52,877 | $8,000 | $44,877 |
| 2019 | $568 | $50,430 | $5,600 | $44,830 |
| 2018 | $415 | $40,618 | $5,600 | $35,018 |
| 2017 | $0 | $32,608 | $5,600 | $27,008 |
| 2016 | $261 | $25,733 | $5,600 | $20,133 |
| 2015 | $253 | $0 | $0 | $0 |
| 2014 | $202 | $23,583 | $5,600 | $17,983 |
Source: Public Records
Map
Nearby Homes
- 8207 Dunellen Ln
- 8117 Attleboro Dr
- 8238 Canyon Forge Dr
- 20 Skylark Ln
- 8043 Sparrow Ct
- 8317 Mountain Pass
- 42 Skylark Ln Unit 1
- 8173 Canyon Forge Dr
- 8303 Taylor Rd
- 8265 Attleboro Dr
- 46 Royce Dr
- 8344 Dunellen Ln
- 37 Royce Dr Unit LOT 21
- 45 Royce Dr
- 8356 Dunellen Ln
- 55 Royce Dr Unit 5
- 274 Park Ridge Ct
- 8448 Taylor Rd
- 246 Saddleview Trail
- 8413 Glenwoods Terrace
- 8134 S Oak Ct
- 46 Birch Chase
- 40 Birch Chase Unit 3
- 32 Birch Chase Unit 3
- 54 Birch Chase Unit 3
- 8135 Mountain Pass
- S S Oak Ct
- 8141 Mountain Pass Unit 4
- 8141 Mountain Pass
- 8129 Mountain Pass Unit 4
- 26 Birch Chase
- 8135 S Oak Ct
- 8123 Mountain Pass Unit 4
- 64 Birch Chase
- 8147 Mountain Pass Unit 8147
- 8147 Mountain Pass Unit n/a
- 8147 Mountain Pass
- 8153 Mountain Pass
- 8117 Mountain Pass
- 43 Birch Chase Unit 3