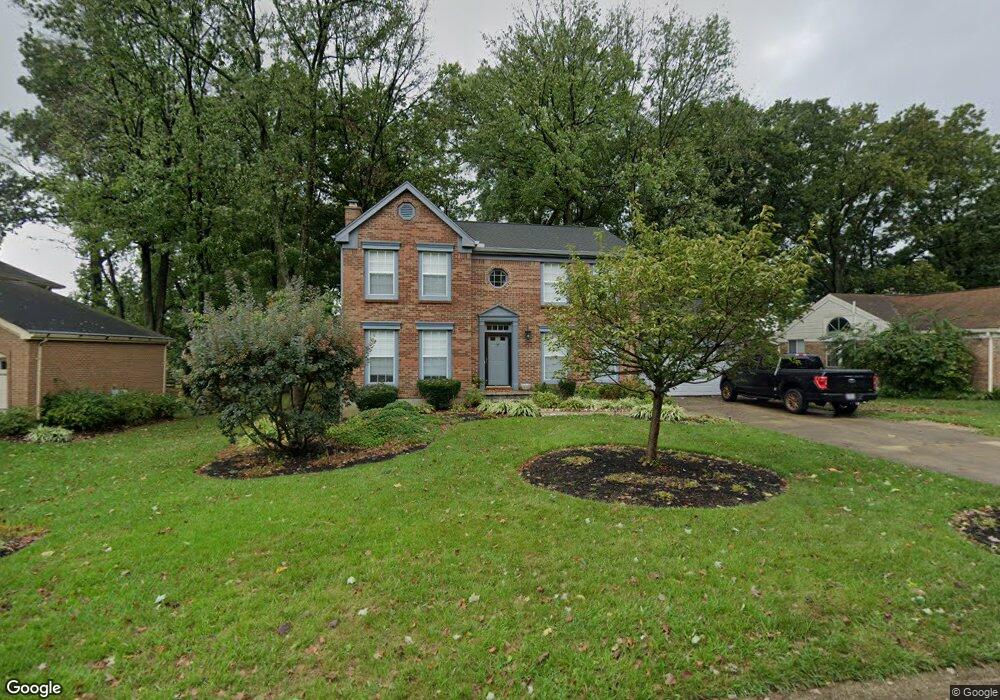
8131 Nagelwoods Dr Cincinnati, OH 45255
Estimated Value: $392,000 - $456,000
3
Beds
3
Baths
1,810
Sq Ft
$234/Sq Ft
Est. Value
About This Home
This home is located at 8131 Nagelwoods Dr, Cincinnati, OH 45255 and is currently estimated at $424,295, approximately $234 per square foot. 8131 Nagelwoods Dr is a home located in Hamilton County with nearby schools including Wilson Elementary School, Nagel Middle School, and Turpin High School.
Ownership History
Date
Name
Owned For
Owner Type
Purchase Details
Closed on
Jun 21, 2024
Sold by
Hart Thomas M and Hart Eileen
Bought by
Chaney Nathan Carl and Chaney Brittany M
Current Estimated Value
Home Financials for this Owner
Home Financials are based on the most recent Mortgage that was taken out on this home.
Original Mortgage
$191,500
Outstanding Balance
$181,575
Interest Rate
6.38%
Mortgage Type
New Conventional
Estimated Equity
$242,721
Purchase Details
Closed on
Jun 24, 1994
Sold by
Wikette Frank J and Wikette Karen S
Bought by
Hart Thomas M and Hart Eileen
Home Financials for this Owner
Home Financials are based on the most recent Mortgage that was taken out on this home.
Original Mortgage
$125,000
Interest Rate
8.66%
Create a Home Valuation Report for This Property
The Home Valuation Report is an in-depth analysis detailing your home's value as well as a comparison with similar homes in the area
Home Values in the Area
Average Home Value in this Area
Purchase History
| Date | Buyer | Sale Price | Title Company |
|---|---|---|---|
| Chaney Nathan Carl | $391,500 | Northwest Title | |
| Hart Thomas M | -- | -- |
Source: Public Records
Mortgage History
| Date | Status | Borrower | Loan Amount |
|---|---|---|---|
| Open | Chaney Nathan Carl | $191,500 | |
| Previous Owner | Hart Thomas M | $125,000 |
Source: Public Records
Tax History Compared to Growth
Tax History
| Year | Tax Paid | Tax Assessment Tax Assessment Total Assessment is a certain percentage of the fair market value that is determined by local assessors to be the total taxable value of land and additions on the property. | Land | Improvement |
|---|---|---|---|---|
| 2024 | $7,247 | $119,379 | $23,433 | $95,946 |
| 2023 | $6,893 | $119,379 | $23,433 | $95,946 |
| 2022 | $5,191 | $80,046 | $21,123 | $58,923 |
| 2021 | $5,068 | $80,046 | $21,123 | $58,923 |
| 2020 | $5,126 | $80,046 | $21,123 | $58,923 |
| 2019 | $4,996 | $70,837 | $18,694 | $52,143 |
| 2018 | $4,680 | $70,837 | $18,694 | $52,143 |
| 2017 | $4,413 | $70,837 | $18,694 | $52,143 |
| 2016 | $4,707 | $73,819 | $20,188 | $53,631 |
| 2015 | $4,572 | $73,819 | $20,188 | $53,631 |
| 2014 | $4,575 | $73,819 | $20,188 | $53,631 |
| 2013 | $4,006 | $68,352 | $18,694 | $49,658 |
Source: Public Records
Map
Nearby Homes
- 8190 Riovista Dr
- 1682 Yellowglen Dr
- L Clough Pike
- 7660 Clough Pike
- 7652 Clough Pike
- 8022 Stonegate Dr
- 7827 State Rd
- 2083 Forestcrest Way
- 8019 Stonegate Dr
- 1434 Castleberry Ct
- 2117 Berrypatch Dr
- 1363 Oak Ct
- 8413 Summitridge Dr
- 1357 Oak Ct
- 1380 Yellowglen Dr
- 1400 Sigma Cir
- 8032 Lancelot Dr
- 1786 Woodpine Ln
- 8240 Woodglen Dr
- 2193 Forestlake Dr
- 7974 Nagel Village Dr
- 8143 Nagelwoods Dr
- 8130 Nagelwoods Dr
- 8105 Nagelwoods Dr
- 8155 Nagelwoods Dr
- 8142 Nagelwoods Dr
- 1714 Nagel Rd
- 8120 Nagelwoods Dr
- 1735 Wexwood Ln
- 1710 Nagel Rd
- 8154 Nagelwoods Dr
- 1721 Wexwood Ln
- 8106 Nagelwoods Dr
- 8131 Thicket Ln
- 1709 Wexwood Ln
- 8129 Thicket Ln
- 8139 Thicket Ln
- 1748 Wexwood Ln
- 8145 Thicket Ln
- 1760 Wexwood Ln