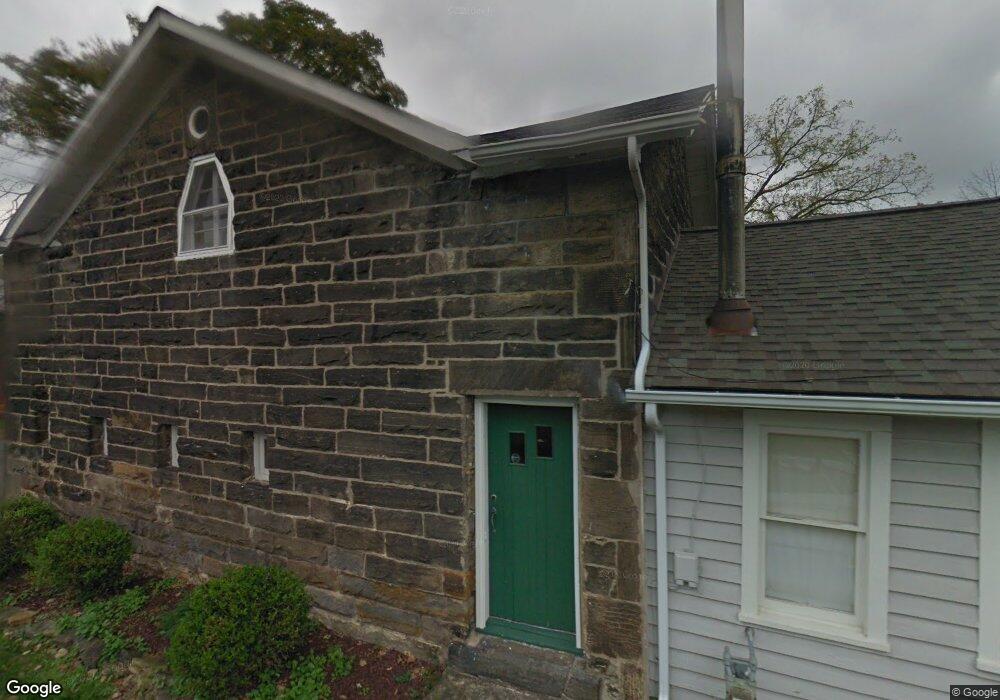
8131 Orchard St Olmsted Falls, OH 44138
Estimated Value: $210,396 - $290,000
3
Beds
2
Baths
1,523
Sq Ft
$171/Sq Ft
Est. Value
About This Home
This home is located at 8131 Orchard St, Olmsted Falls, OH 44138 and is currently estimated at $260,349, approximately $170 per square foot. 8131 Orchard St is a home located in Cuyahoga County with nearby schools including Falls-Lenox Primary Elementary School, Olmsted Falls Intermediate Building, and Olmsted Falls Middle School.
Ownership History
Date
Name
Owned For
Owner Type
Purchase Details
Closed on
Aug 19, 2008
Sold by
Mcwilliam Carla R
Bought by
Thymeless Expressions Llc
Current Estimated Value
Purchase Details
Closed on
Mar 28, 2008
Sold by
Mcwilliam Carla
Bought by
Thymeless Expressions Llc
Purchase Details
Closed on
Oct 31, 2007
Sold by
Mcwilliam Carla
Bought by
Thymeless Expressions Llc
Purchase Details
Closed on
Aug 10, 1990
Sold by
Fisher Robert J
Bought by
Mcwilliam Carla
Purchase Details
Closed on
Oct 23, 1978
Sold by
Linda M Mellino
Bought by
Fisher Robert J
Purchase Details
Closed on
Oct 5, 1977
Sold by
Hecker Dorothy G
Bought by
Mellino Randal
Purchase Details
Closed on
May 13, 1976
Sold by
Hecker Dale H and Hecker Dorothy
Bought by
Hecker Dorothy G
Purchase Details
Closed on
Jan 1, 1975
Bought by
Hecker Dale H and Hecker Dorothy
Create a Home Valuation Report for This Property
The Home Valuation Report is an in-depth analysis detailing your home's value as well as a comparison with similar homes in the area
Home Values in the Area
Average Home Value in this Area
Purchase History
| Date | Buyer | Sale Price | Title Company |
|---|---|---|---|
| Thymeless Expressions Llc | -- | Accommodation | |
| Thymeless Expressions Llc | -- | Gateway Title Agency Inc | |
| Thymeless Expressions Llc | $193,000 | Gateway Title Agency Inc | |
| Mcwilliam Carla | $60,000 | -- | |
| Fisher Robert J | $52,000 | -- | |
| Linda M Mellino | -- | -- | |
| Mellino Randal | $47,000 | -- | |
| Hecker Dorothy G | -- | -- | |
| Hecker Dale H | -- | -- |
Source: Public Records
Tax History Compared to Growth
Tax History
| Year | Tax Paid | Tax Assessment Tax Assessment Total Assessment is a certain percentage of the fair market value that is determined by local assessors to be the total taxable value of land and additions on the property. | Land | Improvement |
|---|---|---|---|---|
| 2024 | $4,495 | $66,570 | $11,410 | $55,160 |
| 2023 | $4,682 | $57,200 | $10,680 | $46,520 |
| 2022 | $4,639 | $57,190 | $10,680 | $46,520 |
| 2021 | $4,596 | $57,190 | $10,680 | $46,520 |
| 2020 | $4,158 | $45,750 | $8,540 | $37,210 |
| 2019 | $3,702 | $130,700 | $24,400 | $106,300 |
| 2018 | $1,858 | $45,750 | $8,540 | $37,210 |
| 2017 | $5,936 | $69,270 | $8,470 | $60,800 |
| 2016 | $5,909 | $69,270 | $8,470 | $60,800 |
| 2015 | $5,804 | $69,270 | $8,470 | $60,800 |
| 2014 | $5,804 | $64,120 | $7,840 | $56,280 |
Source: Public Records
Map
Nearby Homes
- 0
- 25950 Bagley Rd
- V/L Columbia Rd
- 8241 Lewis Rd
- 7593 Columbia Rd
- 281-12-024 River Rd
- 281-12-007 River Rd
- 25725 Cook Rd
- Anderson Plan at Smokestack Trails
- Bramante Ranch Plan at Smokestack Trails
- Hudson Plan at Smokestack Trails
- Columbia Plan at Smokestack Trails
- Lehigh Plan at Smokestack Trails
- 26685 Cranage Rd
- 260 Stone Ridge Way
- 3 Dogwood Ln
- 136 River Rock Way Unit D
- 27 Sycamore Dr
- 5 Hawthorn Dr
- 100 River Rock Way
- 8153 Orchard St
- 25596 Mill St
- 8161 Orchard St
- 8134 Columbia Rd
- 8158 Orchard St
- 8143 Columbia Rd
- 8094 Columbia Rd
- 8154 Columbia Rd
- 8179 Orchard St
- 8098 Columbia Rd
- 8078 Columbia Rd
- 8080 Columbia Rd
- 8200 Columbia Rd
- 8074 Columbia Rd
- 8068 Columbia Rd
- 8089 Columbia Rd
- 25660 Bagley Rd
- 8119 Columbia Rd
- 8051 Brookside Dr
- 25673 Mill St