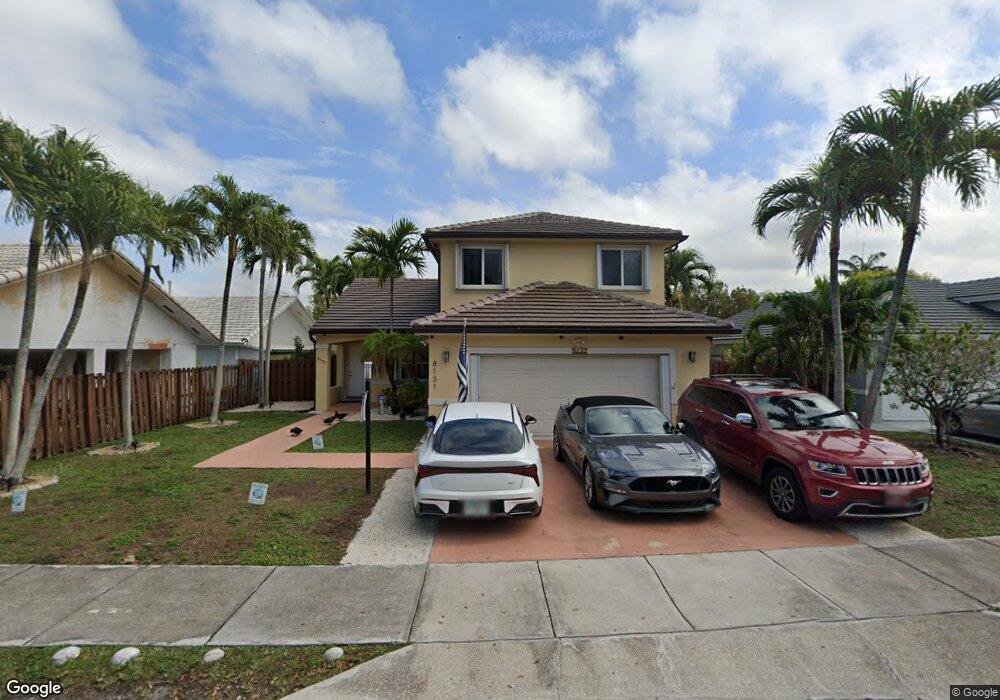
8131 SW 160th Ave Miami, FL 33193
Kendale Lakes West NeighborhoodEstimated Value: $724,000 - $791,000
4
Beds
3
Baths
2,285
Sq Ft
$332/Sq Ft
Est. Value
About This Home
This home is located at 8131 SW 160th Ave, Miami, FL 33193 and is currently estimated at $759,540, approximately $332 per square foot. 8131 SW 160th Ave is a home located in Miami-Dade County with nearby schools including Dante B. Fascell Elementary School, Hammocks Middle School, and Felix Varela Senior High School.
Ownership History
Date
Name
Owned For
Owner Type
Purchase Details
Closed on
Mar 31, 2011
Sold by
Mayia Holdings Inc
Bought by
Lamoglia Albert F and Lamoglia Elizabeth A
Current Estimated Value
Home Financials for this Owner
Home Financials are based on the most recent Mortgage that was taken out on this home.
Original Mortgage
$196,000
Outstanding Balance
$136,167
Interest Rate
4.95%
Mortgage Type
New Conventional
Estimated Equity
$623,373
Purchase Details
Closed on
Oct 25, 2010
Sold by
Diaz Mavel
Bought by
Mayia Holdings Inc
Purchase Details
Closed on
Jul 7, 2000
Sold by
Yilalis Victoria and Flores Fredy
Bought by
Diaz Mavel
Purchase Details
Closed on
May 26, 1998
Sold by
Continental Homes Of Florida Inc
Bought by
Yilalis Victoria
Home Financials for this Owner
Home Financials are based on the most recent Mortgage that was taken out on this home.
Original Mortgage
$131,700
Interest Rate
7.04%
Mortgage Type
Credit Line Revolving
Create a Home Valuation Report for This Property
The Home Valuation Report is an in-depth analysis detailing your home's value as well as a comparison with similar homes in the area
Home Values in the Area
Average Home Value in this Area
Purchase History
| Date | Buyer | Sale Price | Title Company |
|---|---|---|---|
| Lamoglia Albert F | $250,000 | Ez Title Services | |
| Mayia Holdings Inc | $167,300 | None Available | |
| Diaz Mavel | $164,000 | -- | |
| Yilalis Victoria | $164,700 | -- |
Source: Public Records
Mortgage History
| Date | Status | Borrower | Loan Amount |
|---|---|---|---|
| Open | Lamoglia Albert F | $196,000 | |
| Previous Owner | Yilalis Victoria | $119,809 | |
| Previous Owner | Yilalis Victoria | $126,000 | |
| Previous Owner | Yilalis Victoria | $131,700 |
Source: Public Records
Tax History Compared to Growth
Tax History
| Year | Tax Paid | Tax Assessment Tax Assessment Total Assessment is a certain percentage of the fair market value that is determined by local assessors to be the total taxable value of land and additions on the property. | Land | Improvement |
|---|---|---|---|---|
| 2025 | $6,710 | $405,412 | -- | -- |
| 2024 | $6,409 | $393,987 | -- | -- |
| 2023 | $6,409 | $382,512 | $0 | $0 |
| 2022 | $6,175 | $371,371 | $0 | $0 |
| 2021 | $6,145 | $360,555 | $151,452 | $209,103 |
| 2020 | $6,729 | $352,665 | $151,452 | $201,213 |
| 2019 | $6,709 | $350,540 | $151,452 | $199,088 |
| 2018 | $6,318 | $338,027 | $136,452 | $201,575 |
| 2017 | $6,059 | $318,014 | $0 | $0 |
| 2016 | $5,769 | $296,831 | $0 | $0 |
| 2015 | $5,377 | $269,847 | $0 | $0 |
| 2014 | $5,117 | $245,432 | $0 | $0 |
Source: Public Records
Map
Nearby Homes
- 15905 SW 83rd Terrace
- 8101 SW 159th Ct
- 16034 SW 83rd Terrace
- 16131 SW 79th Terrace
- 16096 SW 85th St
- 16054 SW 77th Terrace
- 15855 SW 86th Terrace
- 7891 SW 162nd Ct
- 7830 SW 161st Place
- 15921 SW 82nd St
- 15788 SW 77th St
- 15620 SW 80th St Unit H101
- 16317 SW 79th Terrace
- 15685 SW 84th Terrace Unit 801
- 15685 SW 82nd Cir Ln Unit 28
- 15600 SW 80th St Unit L-203
- 8301 SW 157th Ave Unit 205
- 15665 SW 82nd Cir Ln Unit 4-4
- 15665 SW 82nd Cir Ln Unit 415
- 7682 SW 157th Ct
- 8151 SW 160th Ave
- 15982 SW 81st Terrace
- 15976 SW 81st Terrace
- 8151 SW 160 Ave
- 15991 SW 82nd St
- 15970 SW 81st Terrace
- 15964 SW 81st Terrace
- 15977 SW 82nd St
- 8215 SW 160th Ave
- 15960 SW 81st Terrace
- 8123 SW 160th Ave
- 8140 SW 159th Place
- 15986 SW 82nd St
- 15971 SW 82nd St
- 15978 SW 82nd St
- 15954 SW 81st Terrace
- 8133 SW 160th Ave
- 8130 SW 159th Place
- 15972 SW 82nd St