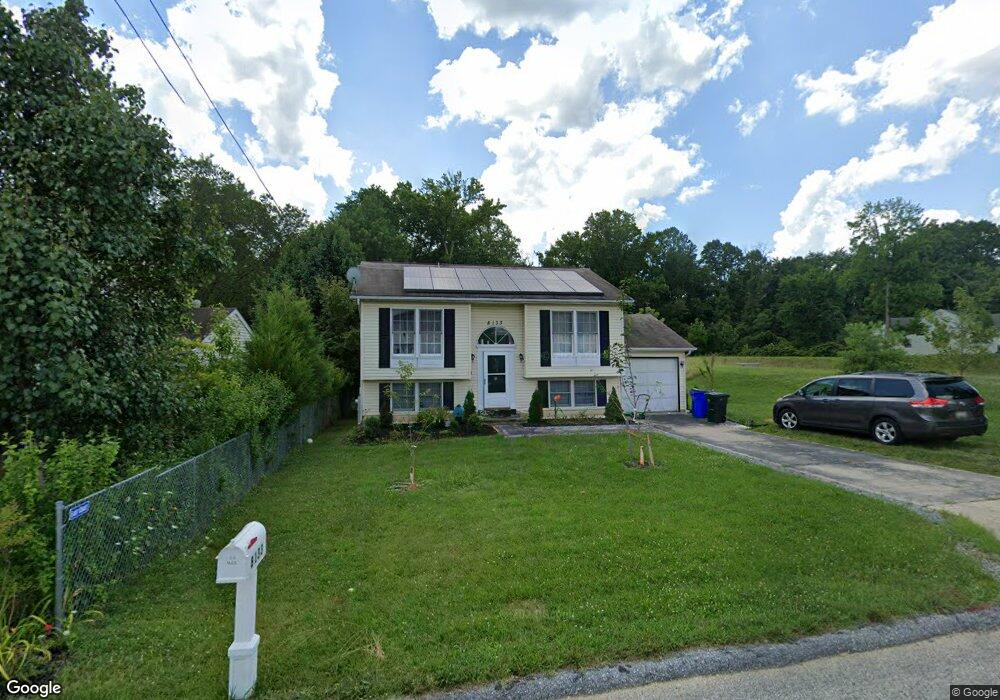
8133 Hicks Rd Jessup, MD 20794
Estimated Value: $401,000 - $473,000
4
Beds
2
Baths
828
Sq Ft
$526/Sq Ft
Est. Value
About This Home
This home is located at 8133 Hicks Rd, Jessup, MD 20794 and is currently estimated at $435,331, approximately $525 per square foot. 8133 Hicks Rd is a home located in Howard County with nearby schools including Hanover Hills Elementary, Thomas Viaduct Middle School, and Bethel Christian Academy.
Ownership History
Date
Name
Owned For
Owner Type
Purchase Details
Closed on
May 18, 2015
Sold by
The Bank Of New York Mellon
Bought by
Cin Ngin Hen and Huai Mary
Current Estimated Value
Home Financials for this Owner
Home Financials are based on the most recent Mortgage that was taken out on this home.
Original Mortgage
$191,200
Outstanding Balance
$147,133
Interest Rate
3.65%
Mortgage Type
New Conventional
Estimated Equity
$288,198
Purchase Details
Closed on
Mar 16, 2015
Sold by
Page Marcus R and Page Rosia L
Bought by
The Bank Of New York Mellon
Purchase Details
Closed on
Feb 9, 1993
Sold by
New Concept Homes
Bought by
Page Marcus R and Page Rosia L T
Home Financials for this Owner
Home Financials are based on the most recent Mortgage that was taken out on this home.
Original Mortgage
$129,150
Interest Rate
7.8%
Purchase Details
Closed on
Dec 17, 1992
Sold by
Hunter Alma
Bought by
New Concept Homes
Home Financials for this Owner
Home Financials are based on the most recent Mortgage that was taken out on this home.
Original Mortgage
$129,150
Interest Rate
7.8%
Purchase Details
Closed on
Sep 17, 1988
Sold by
Gist Loura L L and Gist E
Bought by
Hunter Alma
Create a Home Valuation Report for This Property
The Home Valuation Report is an in-depth analysis detailing your home's value as well as a comparison with similar homes in the area
Home Values in the Area
Average Home Value in this Area
Purchase History
| Date | Buyer | Sale Price | Title Company |
|---|---|---|---|
| Cin Ngin Hen | $239,000 | None Available | |
| The Bank Of New York Mellon | $259,250 | None Available | |
| Page Marcus R | $136,100 | -- | |
| New Concept Homes | $15,000 | -- | |
| Hunter Alma | $3,000 | -- |
Source: Public Records
Mortgage History
| Date | Status | Borrower | Loan Amount |
|---|---|---|---|
| Open | Cin Ngin Hen | $191,200 | |
| Previous Owner | Page Marcus R | $129,150 | |
| Previous Owner | New Concept Homes | $45,000 |
Source: Public Records
Tax History
| Year | Tax Paid | Tax Assessment Tax Assessment Total Assessment is a certain percentage of the fair market value that is determined by local assessors to be the total taxable value of land and additions on the property. | Land | Improvement |
|---|---|---|---|---|
| 2025 | $4,972 | $347,400 | $175,000 | $172,400 |
| 2024 | $4,972 | $329,367 | $0 | $0 |
| 2023 | $4,659 | $311,333 | $0 | $0 |
| 2022 | $4,411 | $293,300 | $150,000 | $143,300 |
| 2021 | $4,021 | $275,967 | $0 | $0 |
| 2020 | $4,021 | $258,633 | $0 | $0 |
| 2019 | $3,837 | $241,300 | $105,000 | $136,300 |
| 2018 | $3,594 | $240,500 | $0 | $0 |
| 2017 | $3,570 | $241,300 | $0 | $0 |
| 2016 | -- | $238,900 | $0 | $0 |
| 2015 | -- | $230,967 | $0 | $0 |
| 2014 | -- | $223,033 | $0 | $0 |
Source: Public Records
Map
Nearby Homes
- 8449 Oak Meade Way
- Lot 7 Cedar Ave
- Lot 6 Cedar Ave
- 7370 Cedar Ave
- 7368 Cedar Ave
- 8253 Macintosh Ct
- 8162 Mission Rd
- 8304 Granville Rd
- 7366 Matchbox Aly
- 7503 Hearthside Way
- 8353 Ashwood Rd Unit 8353
- 7345 Matchbox Aly
- 7300 Summit Rock Rd
- 7308 Summit Rock Rd
- 7112 Penny Ln
- 7160 Deep Falls Way
- 7738 -B Port Capital Dr Unit B
- 7300 Point Patience Way
- 7129 Stone Throw Way
- 7582 Cherrybark Oak Ln
- 8133 Hicks Rd
- 8131 Hicks Rd
- 8129 Hicks Rd
- 8161 Hicks Rd
- 8470 Jacqueline Ct
- 8155 Hicks Rd
- 8474 Jacqueline Ct
- 8127 Hicks Rd
- 8454 Jacqueline Ct
- 8151 Hicks Rd
- 8130 Hicks Rd
- 8450 Jacqueline Ct
- 8125 Hicks Rd
- 8478 Jacqueline Ct
- 8466 Jacqueline Ct
- 8462 Jacqueline Ct
- 8482 Jacqueline Ct
- 7410 Charlie Joyner Dr
- 8170 Hicks Rd
- 7412 Charlie Joyner Dr
Your Personal Tour Guide
Ask me questions while you tour the home.