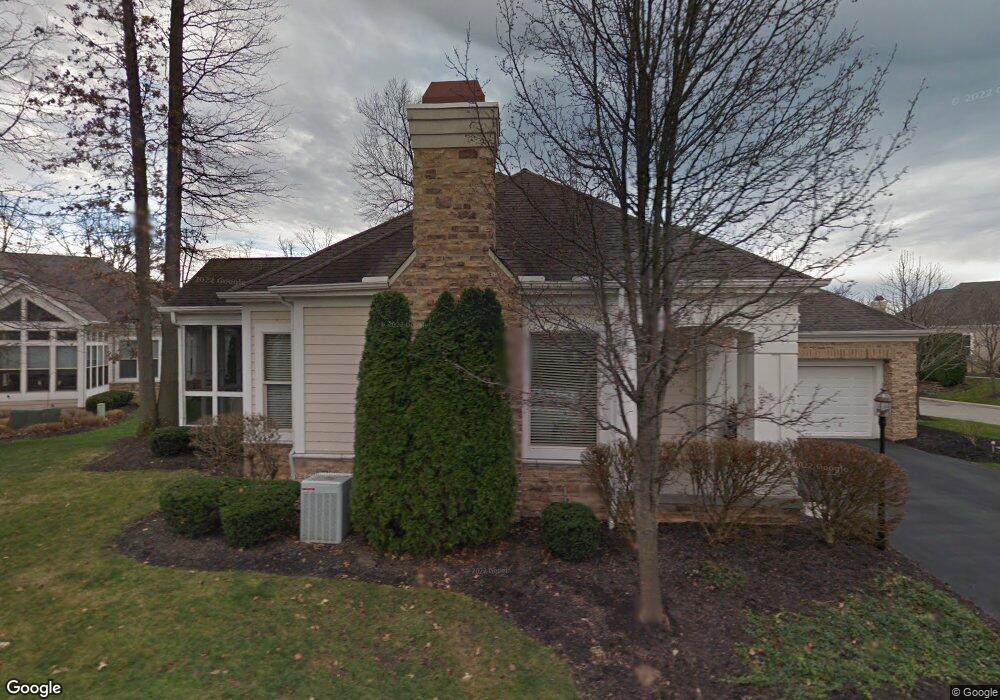
8136 Julian Dr Unit MC10A Westerville, OH 43082
Genoa NeighborhoodEstimated Value: $447,000 - $558,000
3
Beds
3
Baths
2,090
Sq Ft
$243/Sq Ft
Est. Value
About This Home
This home is located at 8136 Julian Dr Unit MC10A, Westerville, OH 43082 and is currently estimated at $508,240, approximately $243 per square foot. 8136 Julian Dr Unit MC10A is a home located in Delaware County with nearby schools including Fouse Elementary School, Genoa Middle School, and Westerville Central High School.
Ownership History
Date
Name
Owned For
Owner Type
Purchase Details
Closed on
Sep 15, 2022
Sold by
Goff Philip D and Goff Judith S
Bought by
Walker Living Trust
Current Estimated Value
Purchase Details
Closed on
Oct 22, 2004
Sold by
Cass Susan B
Bought by
Goff Philip D and Judith Goff S
Home Financials for this Owner
Home Financials are based on the most recent Mortgage that was taken out on this home.
Original Mortgage
$274,400
Interest Rate
4.62%
Mortgage Type
Purchase Money Mortgage
Purchase Details
Closed on
May 30, 2002
Sold by
Duffy Homes Inc
Bought by
Cass Susan B
Home Financials for this Owner
Home Financials are based on the most recent Mortgage that was taken out on this home.
Original Mortgage
$279,507
Interest Rate
7%
Mortgage Type
New Conventional
Create a Home Valuation Report for This Property
The Home Valuation Report is an in-depth analysis detailing your home's value as well as a comparison with similar homes in the area
Home Values in the Area
Average Home Value in this Area
Purchase History
| Date | Buyer | Sale Price | Title Company |
|---|---|---|---|
| Walker Living Trust | $143,333 | Crown Search Box | |
| Goff Philip D | -- | Ohio Title Agency | |
| Cass Susan B | $293,761 | -- |
Source: Public Records
Mortgage History
| Date | Status | Borrower | Loan Amount |
|---|---|---|---|
| Previous Owner | Goff Philip D | $274,400 | |
| Previous Owner | Cass Susan B | $279,507 |
Source: Public Records
Tax History Compared to Growth
Tax History
| Year | Tax Paid | Tax Assessment Tax Assessment Total Assessment is a certain percentage of the fair market value that is determined by local assessors to be the total taxable value of land and additions on the property. | Land | Improvement |
|---|---|---|---|---|
| 2024 | $6,696 | $148,370 | $26,430 | $121,940 |
| 2023 | $6,599 | $148,370 | $26,430 | $121,940 |
| 2022 | $5,858 | $121,380 | $24,500 | $96,880 |
| 2021 | $5,872 | $121,380 | $24,500 | $96,880 |
| 2020 | $5,886 | $121,380 | $24,500 | $96,880 |
| 2019 | $5,737 | $114,210 | $24,500 | $89,710 |
| 2018 | $5,329 | $114,210 | $24,500 | $89,710 |
| 2017 | $2,511 | $109,200 | $21,000 | $88,200 |
| 2016 | $4,779 | $109,200 | $21,000 | $88,200 |
| 2015 | $4,803 | $109,200 | $21,000 | $88,200 |
| 2014 | $4,780 | $109,200 | $21,000 | $88,200 |
| 2013 | $5,065 | $109,200 | $21,000 | $88,200 |
Source: Public Records
Map
Nearby Homes
- 7930 Thornbush Dr
- 5386 Medallion Dr W
- 7969 Linksview Cir Unit 7969
- 7871 Linksview Cir Unit 7871
- 5404 Covington Meadows Dr
- 4703 Talus Rd
- 5335 Hoover Gate Ln
- 5746 Bulrush Ct
- 6050 Medallion Dr W
- 5040 Sunbury Rd
- 7310 Pueblo Ct
- 7033 Steeplebush Ave
- 0 S Old 3c Hwy Unit 225045388
- 8216 W Shore Dr
- 7879 Mariposa Dr
- 6723 Hawksnest Ct
- 8025 Genova Dr
- 6623 Henschen Cir
- 8255 Harvest Wind Dr
- 0 Paul Rd Unit 225001038
- 8136 Julian Dr
- 5501 Duvall Dr Unit 5501
- 5501 Duvall Dr Unit MC10B
- 8151 Snead Way
- 8121 Snead Way Unit 8121
- 8121 Snead Way Unit MC10C
- 8163 Snead Way
- 8153 Julian Dr
- 8131 Julian Dr
- 8131 Julian Dr Unit MC3C
- 8175 Snead Way
- 8143 Julian Dr
- 8181 Julian Dr
- 5508 Duvall Dr
- 5508 Duvall Dr Unit MC1A
- 8167 Julian Dr
- 8117 Julian Dr
- 8183 Snead Way
- 8103 Julian Dr
- 8103 Julian Dr Unit MC3A