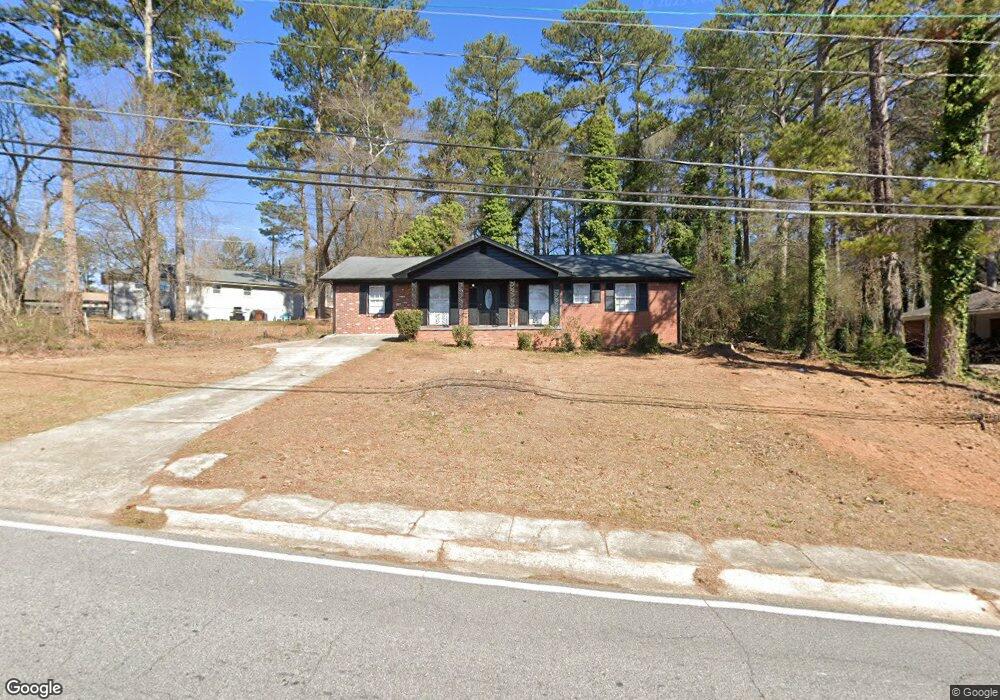
814 Boggs Rd SW Mableton, GA 30126
Estimated Value: $229,000 - $270,000
4
Beds
2
Baths
1,400
Sq Ft
$176/Sq Ft
Est. Value
About This Home
This home is located at 814 Boggs Rd SW, Mableton, GA 30126 and is currently estimated at $247,067, approximately $176 per square foot. 814 Boggs Rd SW is a home located in Cobb County with nearby schools including Clay-Harmony Leland Elementary School, Lindley Middle School, and Pebblebrook High School.
Ownership History
Date
Name
Owned For
Owner Type
Purchase Details
Closed on
Nov 3, 2011
Sold by
Equity Trust
Bought by
Pascal Antoinette M and Pascal Michael H
Current Estimated Value
Home Financials for this Owner
Home Financials are based on the most recent Mortgage that was taken out on this home.
Original Mortgage
$42,800
Outstanding Balance
$29,078
Interest Rate
4.02%
Mortgage Type
New Conventional
Estimated Equity
$227,283
Purchase Details
Closed on
Jun 4, 2010
Sold by
Federal Natl Mtg Assn Fnma
Bought by
Fischer Elia
Purchase Details
Closed on
Jan 5, 2010
Sold by
Chase Hm Fin Llc
Bought by
Federal Natl Mtg Assn Fnma
Purchase Details
Closed on
Oct 3, 2001
Sold by
Gray Charles R and Gray Linda K
Bought by
Gallegos Alberto
Home Financials for this Owner
Home Financials are based on the most recent Mortgage that was taken out on this home.
Original Mortgage
$81,200
Interest Rate
6.87%
Mortgage Type
FHA
Create a Home Valuation Report for This Property
The Home Valuation Report is an in-depth analysis detailing your home's value as well as a comparison with similar homes in the area
Home Values in the Area
Average Home Value in this Area
Purchase History
| Date | Buyer | Sale Price | Title Company |
|---|---|---|---|
| Pascal Antoinette M | $53,500 | -- | |
| Fischer Elia | -- | -- | |
| Federal Natl Mtg Assn Fnma | -- | -- | |
| Chase Hm Fin Llc | $42,100 | -- | |
| Gallegos Alberto | $100,000 | -- |
Source: Public Records
Mortgage History
| Date | Status | Borrower | Loan Amount |
|---|---|---|---|
| Open | Pascal Antoinette M | $42,800 | |
| Previous Owner | Gallegos Alberto | $81,200 |
Source: Public Records
Tax History Compared to Growth
Tax History
| Year | Tax Paid | Tax Assessment Tax Assessment Total Assessment is a certain percentage of the fair market value that is determined by local assessors to be the total taxable value of land and additions on the property. | Land | Improvement |
|---|---|---|---|---|
| 2025 | $2,366 | $78,520 | $33,584 | $44,936 |
| 2024 | $2,367 | $78,520 | $33,584 | $44,936 |
| 2023 | $2,114 | $70,132 | $33,584 | $36,548 |
| 2022 | $1,553 | $51,168 | $21,212 | $29,956 |
| 2021 | $1,336 | $44,012 | $18,384 | $25,628 |
| 2020 | $1,207 | $39,768 | $14,140 | $25,628 |
| 2019 | $1,207 | $39,768 | $14,140 | $25,628 |
| 2018 | $966 | $31,820 | $8,132 | $23,688 |
| 2017 | $663 | $23,068 | $5,304 | $17,764 |
| 2016 | $663 | $23,068 | $5,304 | $17,764 |
| 2015 | $662 | $22,484 | $3,536 | $18,948 |
| 2014 | $596 | $20,076 | $0 | $0 |
Source: Public Records
Map
Nearby Homes
- 6266 Britt Rd SW
- 6281 Denny Ln SW
- Harbor Plan at Mableton Station
- Robie Plan at Mableton Station
- Aisle Plan at Mableton Station
- Elston Plan at Mableton Station
- 5981 Pisgah Rd SW
- 846 Orris Ln SW
- 767 Kenneth Ln SW
- 6243 Honeybell Aly
- KNOLLWOOD Plan at Mableton Station - Townhomes
- 6302 Mount Pisgah Ln
- 537 Elizabeth Ln SW
- 496 Elizabeth Ln SW
- 1144 Angelia Dr SW
- 1031 Bettina Ct SW
- 1034 Bettina Ct SW
- 1076 Stoney Creek Ln
- 5777 Whispering Pines Rd SW
- 377 Waterbluff Dr SW
- 802 Boggs Rd SW
- 6139 Pisgah Rd SW
- 6149 Pisgah Rd SW
- 792 Boggs Rd SW
- 6163 Britt Rd SW
- 795 Boggs Rd SW
- 821 Boggs Rd SW
- 6117 Pisgah Rd SW
- 782 Boggs Rd SW
- 783 Boggs Rd SW
- 0 Boggs Rd Unit 7341807
- 6116 Pisgah Rd SW
- 6130 Pisgah Rd SW
- 6138 Pisgah Rd SW
- 6175 Britt Rd SW
- 6104 Pisgah Rd SW Unit 2
- 6104 Pisgah Rd SW Unit B
- 6104 Pisgah Rd SW Unit B
- 6104 Pisgah Rd SW
- 772 Boggs Rd SW