
Seller's Agent in 2018
David Karstedt
1st Texas, Realtors
(713) 885-2228
20 in this area
121 Total Sales

Estimated Value: $389,000 - $440,000
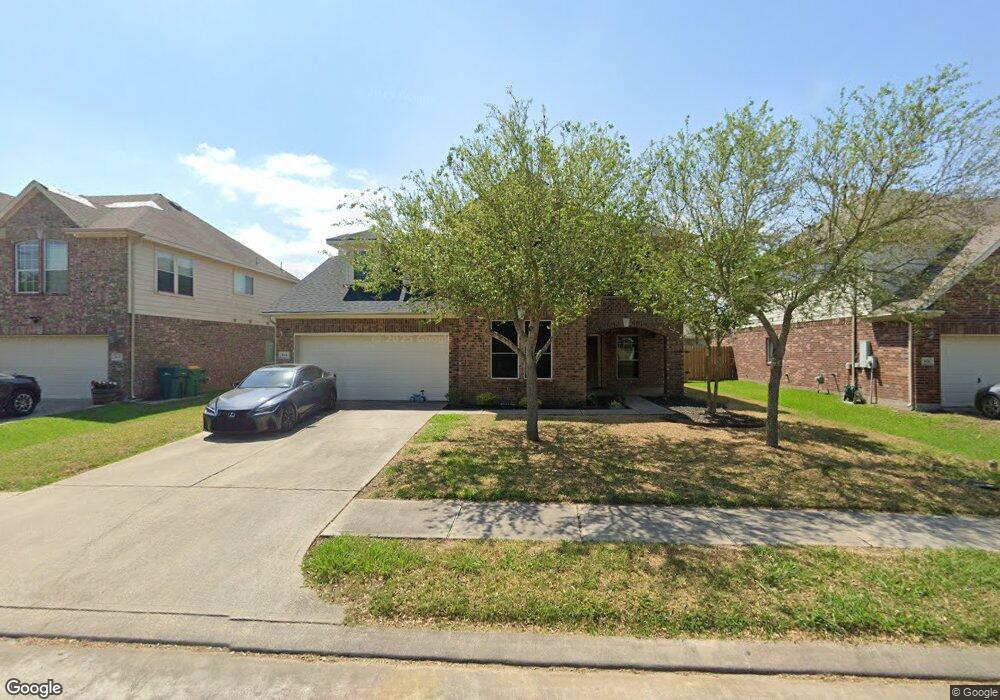
Coastal living close to the city, small community of recently built Bayway homes, close to walking trails and El Jardin Beach and Kemah boardwalk and fishing district of Kemah. Kemah boasts one of the largest marinas in the country. Recognized school district, easy access to Hwy. 146 to I-10 and 225. Surrounded by fabulous real estate on Todville Rd. Large, covered front porch, tile entry, nice sized study or wood floor formal living, open wood dining with archways. Open tile, stainless kitchen with rich, elegant granite, tile backsplash and undermount sink and can lighting. The kitchen has a gas stove top and breakfast nook. Lots of cabinets and counter space. Tile surround fireplace situated next to built ins and granite top cabinets. As you enter the home, you can see a wall of windows in family. utility downstairs off of garage, large, wood master with a wall of windows. Blinds throughout, good size game room up with three beds and full bath.. Nice paint colors, huge back yard.
Last Agent to Sell the Property
1st Texas, Realtors License #0422904 Listed on: 12/28/2017
| Date | Buyer | Sale Price | Title Company |
|---|---|---|---|
| Melanson James R | -- | Alamo Title Company | |
| Harper Justin | -- | American Title Company | |
| Resdential Const Associates | $152,250 | None Available |
| Date | Status | Borrower | Loan Amount |
|---|---|---|---|
| Open | Melanson James R | $214,400 | |
| Previous Owner | Harper Justin | $199,456 | |
| Previous Owner | Resdential Const Associates | $152,250 |
| Date | Event | Price | List to Sale | Price per Sq Ft |
|---|---|---|---|---|
| 12/30/2021 12/30/21 | Off Market | -- | -- | -- |
| 04/23/2018 04/23/18 | Sold | -- | -- | -- |
| 03/24/2018 03/24/18 | Pending | -- | -- | -- |
| 12/28/2017 12/28/17 | For Sale | $284,900 | -- | $107 / Sq Ft |
| Year | Tax Paid | Tax Assessment Tax Assessment Total Assessment is a certain percentage of the fair market value that is determined by local assessors to be the total taxable value of land and additions on the property. | Land | Improvement |
|---|---|---|---|---|
| 2025 | $5,941 | $403,800 | $72,394 | $331,406 |
| 2024 | $5,941 | $390,051 | $72,394 | $317,657 |
| 2023 | $5,941 | $410,180 | $72,394 | $337,786 |
| 2022 | $7,360 | $346,097 | $72,394 | $273,703 |
| 2021 | $7,627 | $332,999 | $63,619 | $269,380 |
| 2020 | $6,967 | $281,063 | $50,625 | $230,438 |
| 2019 | $7,272 | $281,063 | $50,625 | $230,438 |
| 2018 | $2,584 | $272,077 | $38,625 | $233,452 |
| 2017 | $6,911 | $265,771 | $38,625 | $227,146 |
| 2016 | $6,742 | $259,255 | $38,625 | $220,630 |
| 2015 | $4,900 | $247,999 | $32,250 | $215,749 |
| 2014 | $4,900 | $217,368 | $32,250 | $185,118 |
Seller's Agent in 2018
David Karstedt
1st Texas, Realtors
(713) 885-2228
20 in this area
121 Total Sales
Buyer's Agent in 2018
James Coate
Realty Associates
(832) 814-4326
27 Total Sales
Source: Houston Association of REALTORS®
MLS Number: 28222570
APN: 1261080030002
Disclaimer: Certain information contained herein is derived from information provided by parties other than Homes.com. All information provided is deemed reliable, but is not guaranteed to be accurate and should be independently verified.
![]() Copyright 2026, Houston REALTORS® Information Service, Inc.
Copyright 2026, Houston REALTORS® Information Service, Inc.
The information provided is exclusively for consumers’ personal, non-commercial use, and may not be used for any purpose other than to identify prospective properties consumers may be interested in purchasing.
Information is deemed reliable but not guaranteed.
Ask me questions while you tour the home.