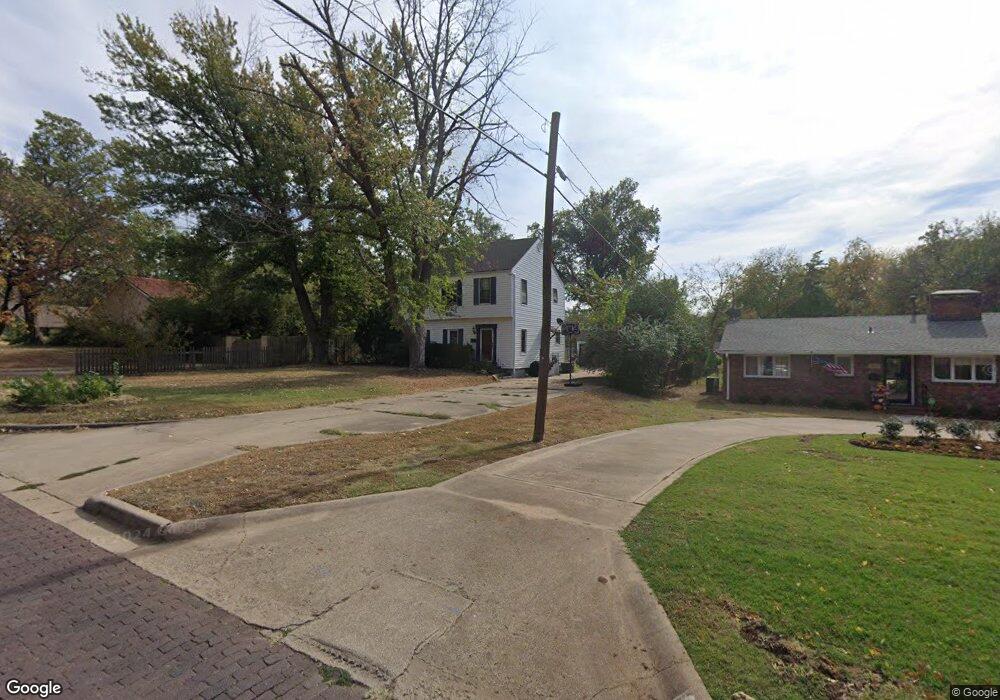
814 E Overbrook Ave Ponca City, OK 74601
Estimated Value: $142,880 - $168,000
3
Beds
2
Baths
1,575
Sq Ft
$100/Sq Ft
Est. Value
About This Home
This home is located at 814 E Overbrook Ave, Ponca City, OK 74601 and is currently estimated at $157,970, approximately $100 per square foot. 814 E Overbrook Ave is a home located in Kay County with nearby schools including Roosevelt Elementary School, Ponca City East Middle School, and Ponca City West Middle School.
Ownership History
Date
Name
Owned For
Owner Type
Purchase Details
Closed on
Aug 1, 2012
Sold by
Dunlap Jeffrey and Dunlap Lisha
Bought by
Arnswald Timothy A and Arnswald Mindy A
Current Estimated Value
Home Financials for this Owner
Home Financials are based on the most recent Mortgage that was taken out on this home.
Original Mortgage
$83,943
Outstanding Balance
$57,685
Interest Rate
3.5%
Mortgage Type
FHA
Estimated Equity
$100,285
Purchase Details
Closed on
Dec 4, 2009
Sold by
Dunlap Jeff and Dunlap Lisha
Bought by
Dunlap Jeffrey and Dunlap Lisha
Home Financials for this Owner
Home Financials are based on the most recent Mortgage that was taken out on this home.
Original Mortgage
$71,500
Interest Rate
5.01%
Mortgage Type
New Conventional
Purchase Details
Closed on
Mar 1, 2004
Sold by
Webb Darrin and Webb Kelly L
Bought by
Jeff Dunlap and Jeff Langhorst L
Purchase Details
Closed on
Feb 1, 1994
Sold by
Roma Mc Donald
Bought by
Webb Darrin K and Webb Kelly L
Create a Home Valuation Report for This Property
The Home Valuation Report is an in-depth analysis detailing your home's value as well as a comparison with similar homes in the area
Home Values in the Area
Average Home Value in this Area
Purchase History
| Date | Buyer | Sale Price | Title Company |
|---|---|---|---|
| Arnswald Timothy A | $85,500 | None Available | |
| Dunlap Jeffrey | -- | -- | |
| Jeff Dunlap | $72,900 | -- | |
| Webb Darrin K | $60,000 | -- |
Source: Public Records
Mortgage History
| Date | Status | Borrower | Loan Amount |
|---|---|---|---|
| Open | Arnswald Timothy A | $83,943 | |
| Previous Owner | Dunlap Jeffrey | $71,500 |
Source: Public Records
Tax History Compared to Growth
Tax History
| Year | Tax Paid | Tax Assessment Tax Assessment Total Assessment is a certain percentage of the fair market value that is determined by local assessors to be the total taxable value of land and additions on the property. | Land | Improvement |
|---|---|---|---|---|
| 2024 | $856 | $10,043 | $1,193 | $8,850 |
| 2023 | $856 | $9,750 | $1,193 | $8,557 |
| 2022 | $806 | $9,466 | $1,193 | $8,273 |
| 2021 | $810 | $9,466 | $1,193 | $8,273 |
| 2020 | $781 | $9,249 | $1,193 | $8,056 |
| 2019 | $762 | $8,979 | $1,193 | $7,786 |
| 2018 | $773 | $8,979 | $1,193 | $7,786 |
| 2017 | $799 | $9,149 | $1,193 | $7,956 |
| 2016 | $824 | $9,318 | $1,193 | $8,125 |
| 2015 | $813 | $9,173 | $1,193 | $7,980 |
| 2014 | $806 | $9,260 | $1,193 | $8,067 |
Source: Public Records
Map
Nearby Homes
- 106 Elmwood Ave
- 121 Hillside Ave
- 214 Virginia Ave
- 734 E Albany Ave
- 1013 N 7th St
- 525 Monument Rd
- 920 N 4th St
- 1412 Donahoe Dr
- 800 Sugar Maple Dr
- 412 N 7th St
- 313 N 12th St
- 410 Drake Dr
- 216 N 12th St Unit 840
- 409 N 5th St
- 213 N 10th St
- 310 N 7th St Unit 660
- 1128 N 14th St
- 417 N 3rd St
- 202 N 7th St
- 304 E Detroit Ave
- 98 Elmwood Ave
- 812 E Overbrook Ave
- 94 Elmwood Ave
- 808 E Overbrook Ave
- 92 Elmwood Ave
- 811 E Overbrook Ave
- 804 E Overbrook Ave
- 813 E Overbrook Ave
- 809 E Overbrook Ave
- 900 E Overbrook Ave
- 301 Virginia Ave
- 90 Elmwood Ave
- 100 Elmwood Ave
- 95 Elmwood Ave
- 904 E Overbrook Ave
- 105 Whitworth Ave
- 88 Elmwood Ave
- 233 Virginia Ave
- 93 Elmwood Ave
- 104 Elmwood Ave