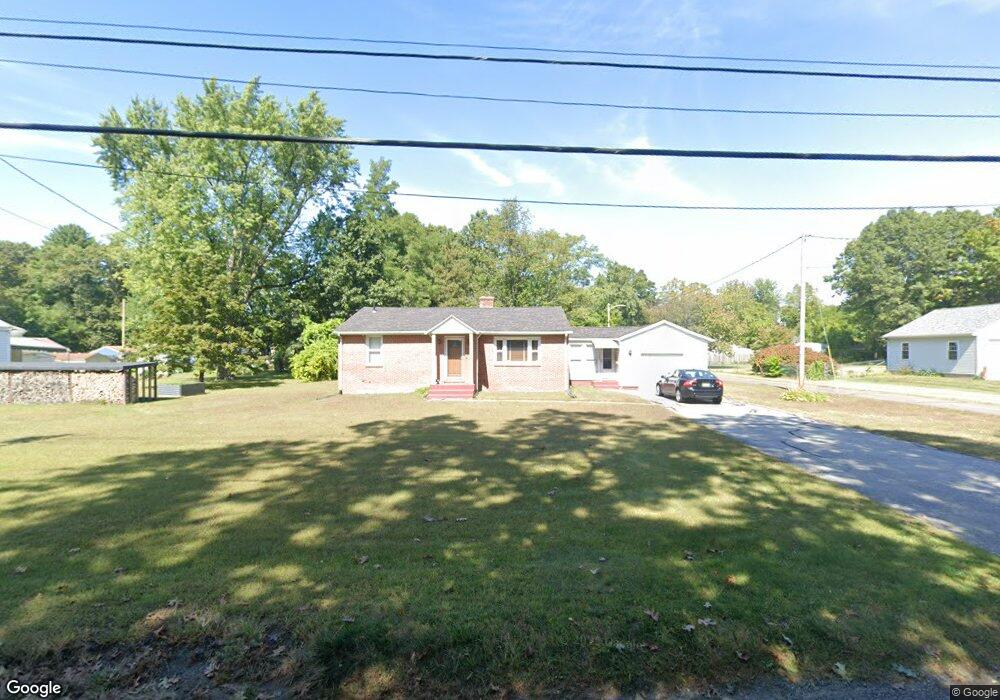
814 Prospect St Chicopee, MA 01020
Fairview NeighborhoodEstimated Value: $319,000 - $332,000
3
Beds
1
Bath
1,092
Sq Ft
$298/Sq Ft
Est. Value
About This Home
This home is located at 814 Prospect St, Chicopee, MA 01020 and is currently estimated at $325,496, approximately $298 per square foot. 814 Prospect St is a home located in Hampden County with nearby schools including Streiber Elementary School, Fairview Middle School, and Chicopee Comprehensive High School.
Ownership History
Date
Name
Owned For
Owner Type
Purchase Details
Closed on
Jun 8, 2007
Sold by
Tiggle Lenora H
Bought by
Tiggle Sherman D and Tiggle George E
Current Estimated Value
Purchase Details
Closed on
Jul 1, 1985
Bought by
Tiggle Sherman D and Tiggle George E
Create a Home Valuation Report for This Property
The Home Valuation Report is an in-depth analysis detailing your home's value as well as a comparison with similar homes in the area
Home Values in the Area
Average Home Value in this Area
Purchase History
| Date | Buyer | Sale Price | Title Company |
|---|---|---|---|
| Tiggle Sherman D | -- | -- | |
| Tiggle Sherman D | $59,900 | -- |
Source: Public Records
Mortgage History
| Date | Status | Borrower | Loan Amount |
|---|---|---|---|
| Previous Owner | Tiggle Sherman D | $10,000 | |
| Previous Owner | Tiggle Sherman D | $49,000 | |
| Previous Owner | Tiggle Sherman D | $10,974 | |
| Previous Owner | Tiggle Sherman D | $57,000 |
Source: Public Records
Tax History
| Year | Tax Paid | Tax Assessment Tax Assessment Total Assessment is a certain percentage of the fair market value that is determined by local assessors to be the total taxable value of land and additions on the property. | Land | Improvement |
|---|---|---|---|---|
| 2025 | $4,407 | $290,700 | $123,000 | $167,700 |
| 2024 | $4,182 | $283,300 | $120,600 | $162,700 |
| 2023 | $3,948 | $260,600 | $109,700 | $150,900 |
| 2022 | $3,765 | $221,600 | $95,300 | $126,300 |
| 2021 | $3,568 | $202,600 | $86,600 | $116,000 |
| 2020 | $3,443 | $197,200 | $89,000 | $108,200 |
| 2019 | $3,402 | $189,400 | $89,000 | $100,400 |
| 2018 | $3,111 | $169,900 | $84,900 | $85,000 |
| 2017 | $2,853 | $164,800 | $77,700 | $87,100 |
| 2016 | $2,723 | $161,000 | $77,700 | $83,300 |
| 2015 | $2,724 | $155,300 | $77,700 | $77,600 |
| 2014 | $1,362 | $155,300 | $77,700 | $77,600 |
Source: Public Records
Map
Nearby Homes
- 81 Mccarthy Ave
- 61 Saint Jacques Ave
- 15 Hudson Ave
- 83 Old Farm Rd
- 341 Montcalm St
- 143 Royal St
- 18 Devlin Dr
- 460 Irene St
- 442 Prospect St
- 90 Anson St
- 128 Ann St
- 104 Johnson Rd Unit 1103
- 104 Johnson Rd Unit 707
- 41 Susan Ave
- 58 Robinridge Rd
- 2085 Memorial Dr
- 35 Ludlow Rd
- 119 Oakridge St
- 210 Johnson Rd Unit 23
- 37 Greenwood Terrace
Your Personal Tour Guide
Ask me questions while you tour the home.