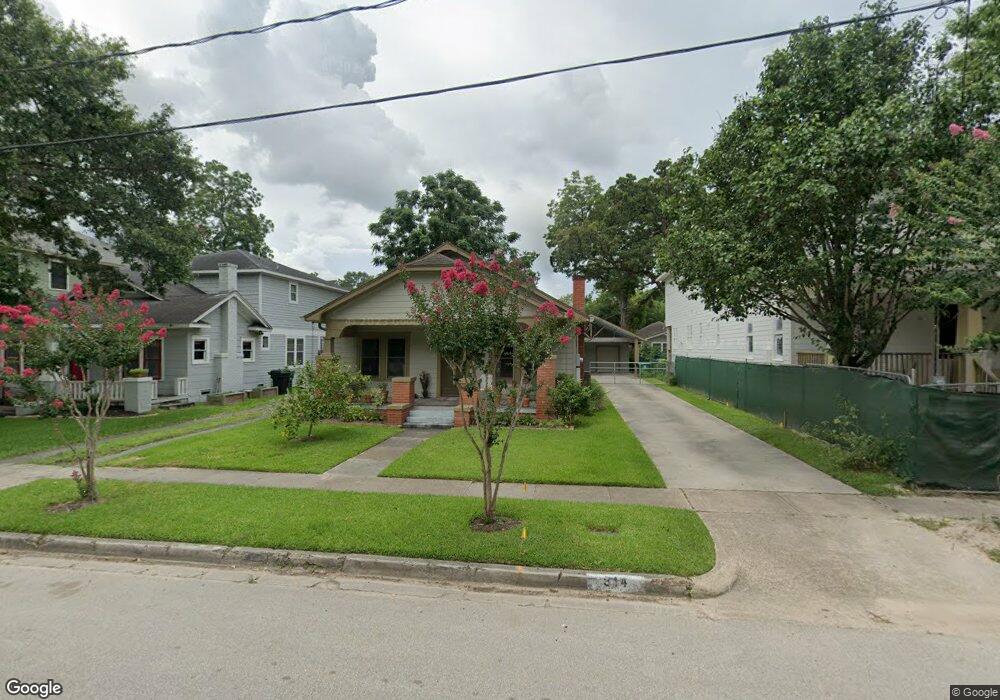
814 Redan St Houston, TX 77009
Greater Heights NeighborhoodEstimated Value: $623,000 - $974,000
3
Beds
2
Baths
1,736
Sq Ft
$475/Sq Ft
Est. Value
About This Home
This home is located at 814 Redan St, Houston, TX 77009 and is currently estimated at $824,838, approximately $475 per square foot. 814 Redan St is a home located in Harris County with nearby schools including Travis Elementary School, Hogg Middle, and Heights High School.
Ownership History
Date
Name
Owned For
Owner Type
Purchase Details
Closed on
Dec 17, 2007
Sold by
Oberholzer Mark A and Oberholzer Leigh A
Bought by
Callaway Clayton Charles and Callaway Catherine M
Current Estimated Value
Home Financials for this Owner
Home Financials are based on the most recent Mortgage that was taken out on this home.
Original Mortgage
$191,200
Outstanding Balance
$120,771
Interest Rate
6.26%
Mortgage Type
Purchase Money Mortgage
Estimated Equity
$704,067
Purchase Details
Closed on
Apr 25, 2003
Sold by
Hartung Marie Elaine Batson
Bought by
Oberholzer Mark A and Oberholzer Leigh A
Home Financials for this Owner
Home Financials are based on the most recent Mortgage that was taken out on this home.
Original Mortgage
$116,000
Interest Rate
5.57%
Create a Home Valuation Report for This Property
The Home Valuation Report is an in-depth analysis detailing your home's value as well as a comparison with similar homes in the area
Home Values in the Area
Average Home Value in this Area
Purchase History
| Date | Buyer | Sale Price | Title Company |
|---|---|---|---|
| Callaway Clayton Charles | -- | Fidelity National Title | |
| Oberholzer Mark A | -- | -- |
Source: Public Records
Mortgage History
| Date | Status | Borrower | Loan Amount |
|---|---|---|---|
| Open | Callaway Clayton Charles | $191,200 | |
| Previous Owner | Oberholzer Mark A | $116,000 |
Source: Public Records
Tax History Compared to Growth
Tax History
| Year | Tax Paid | Tax Assessment Tax Assessment Total Assessment is a certain percentage of the fair market value that is determined by local assessors to be the total taxable value of land and additions on the property. | Land | Improvement |
|---|---|---|---|---|
| 2025 | $13,120 | $809,937 | $625,000 | $184,937 |
| 2024 | $13,120 | $834,240 | $625,000 | $209,240 |
| 2023 | $13,120 | $770,781 | $562,500 | $208,281 |
| 2022 | $15,325 | $696,009 | $518,750 | $177,259 |
| 2021 | $16,138 | $692,435 | $500,000 | $192,435 |
| 2020 | $15,735 | $704,217 | $500,000 | $204,217 |
| 2019 | $14,947 | $625,000 | $500,000 | $125,000 |
| 2018 | $10,623 | $537,000 | $400,000 | $137,000 |
| 2017 | $13,578 | $537,000 | $400,000 | $137,000 |
| 2016 | $12,622 | $595,531 | $360,000 | $235,531 |
| 2015 | $8,348 | $573,031 | $337,500 | $235,531 |
| 2014 | $8,348 | $485,363 | $303,750 | $181,613 |
Source: Public Records
Map
Nearby Homes