Estimated Value: $292,799 - $331,000
Studio
2
Baths
1,824
Sq Ft
$171/Sq Ft
Est. Value
About This Home
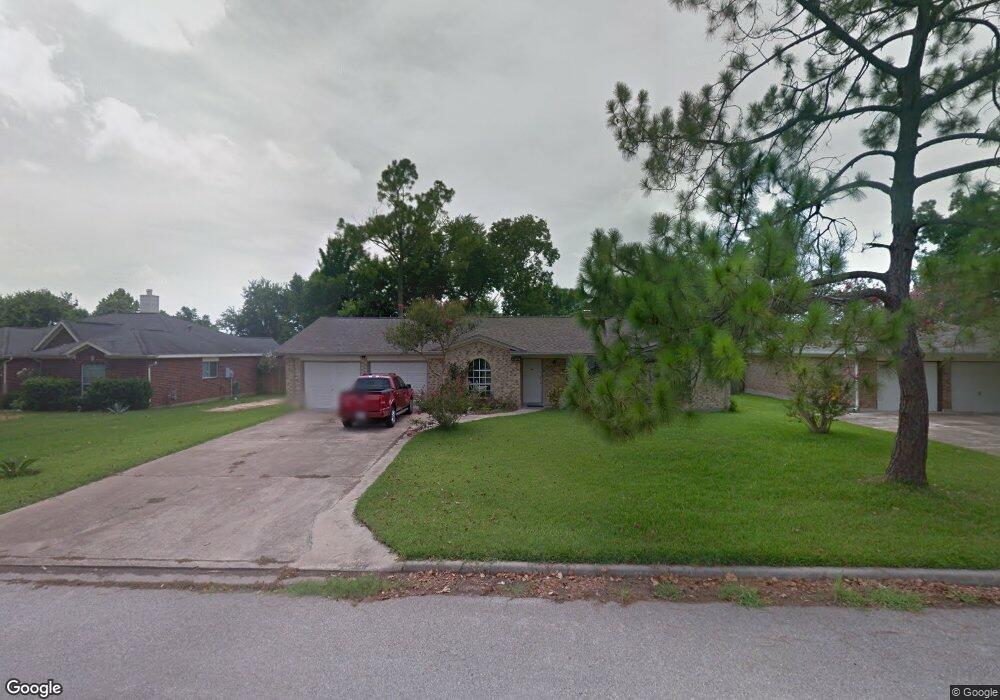
This home is located at 814 Riverside Dr, Alvin, TX 77511 and is currently estimated at $312,450, approximately $171 per square foot. 814 Riverside Dr is a home located in Brazoria County with nearby schools including R.L. Stevenson Primary School, Alvin Junior High School, and Alvin High School.
Ownership History
Date
Name
Owned For
Owner Type
Purchase Details
Closed on
Jul 23, 2012
Sold by
Jones Jerry D
Bought by
Bragg Edwin T
Current Estimated Value
Purchase Details
Closed on
Dec 5, 2005
Sold by
Stroope Garland R
Bought by
Jones Jerry
Home Financials for this Owner
Home Financials are based on the most recent Mortgage that was taken out on this home.
Original Mortgage
$60,000
Interest Rate
6.12%
Mortgage Type
Fannie Mae Freddie Mac
Purchase Details
Closed on
Jun 12, 1998
Sold by
Gloistein Julianne and Gloistein Julianne Metz
Bought by
Stroope Garland R
Home Financials for this Owner
Home Financials are based on the most recent Mortgage that was taken out on this home.
Original Mortgage
$67,000
Interest Rate
7.27%
Create a Home Valuation Report for This Property
The Home Valuation Report is an in-depth analysis detailing your home's value as well as a comparison with similar homes in the area
Home Values in the Area
Average Home Value in this Area
Purchase History
| Date | Buyer | Sale Price | Title Company |
|---|---|---|---|
| Bragg Edwin T | -- | Chicago Title | |
| Jones Jerry | -- | Chicago Title Insurance Co | |
| Stroope Garland R | -- | -- |
Source: Public Records
Mortgage History
| Date | Status | Borrower | Loan Amount |
|---|---|---|---|
| Previous Owner | Jones Jerry | $60,000 | |
| Previous Owner | Stroope Garland R | $67,000 |
Source: Public Records
Tax History
| Year | Tax Paid | Tax Assessment Tax Assessment Total Assessment is a certain percentage of the fair market value that is determined by local assessors to be the total taxable value of land and additions on the property. | Land | Improvement |
|---|---|---|---|---|
| 2025 | $1,507 | $275,371 | $49,420 | $252,590 |
| 2023 | $1,507 | $227,579 | $49,420 | $257,310 |
| 2022 | $4,982 | $206,890 | $40,150 | $187,010 |
| 2021 | $4,717 | $195,510 | $28,510 | $167,000 |
| 2020 | $4,339 | $186,190 | $28,510 | $157,680 |
| 2019 | $4,138 | $157,560 | $26,230 | $131,330 |
| 2018 | $4,142 | $157,560 | $26,230 | $131,330 |
| 2017 | $4,187 | $157,560 | $26,230 | $131,330 |
| 2016 | $3,985 | $149,990 | $22,810 | $127,180 |
| 2015 | $1,709 | $145,630 | $22,810 | $122,820 |
| 2014 | $1,709 | $127,520 | $22,810 | $104,710 |
Source: Public Records
Map
Nearby Homes
- 907 Riverside Dr
- 1214 Main St
- 608 County Road 157
- 101 W Larkspur Dr
- 4127 Country Trails St
- 4707 Shadow Pond Ln
- 410 Riverside Dr
- 201 W Timberlane Dr
- 405 Karlis Dr
- 204 Hillcrest Dr
- 4003 Country Trails St
- 205 Hillcrest Dr
- 3828 County Road 326
- 610 County Road 157
- 4802 Shadow Pond Ln
- 215 Ridgemont Dr
- 210 Ridgemont Dr
- 4029 County Road 326
- 610 Linda Ln
- 111 Fairway Dr
- 812 Riverside Dr
- 816 Riverside Dr
- 810 Riverside Dr
- 818 Riverside Dr
- 815 Riverside Dr
- 819 Riverside Dr
- 822 Riverside Dr
- 811 Riverside Dr
- 807 Riverside Dr
- 906 Riverside Dr
- 805 Riverside Dr
- 910 Riverside Dr
- 802 Riverside Dr
- 1130 County Road 136a
- 1132 Live Oak Dr
- 1001 Main St Unit 156
- 1132 County Road 136a
- 1132 Cr 136 A
- 911 Riverside Dr
- 1138 County Road 136a
Your Personal Tour Guide
Ask me questions while you tour the home.