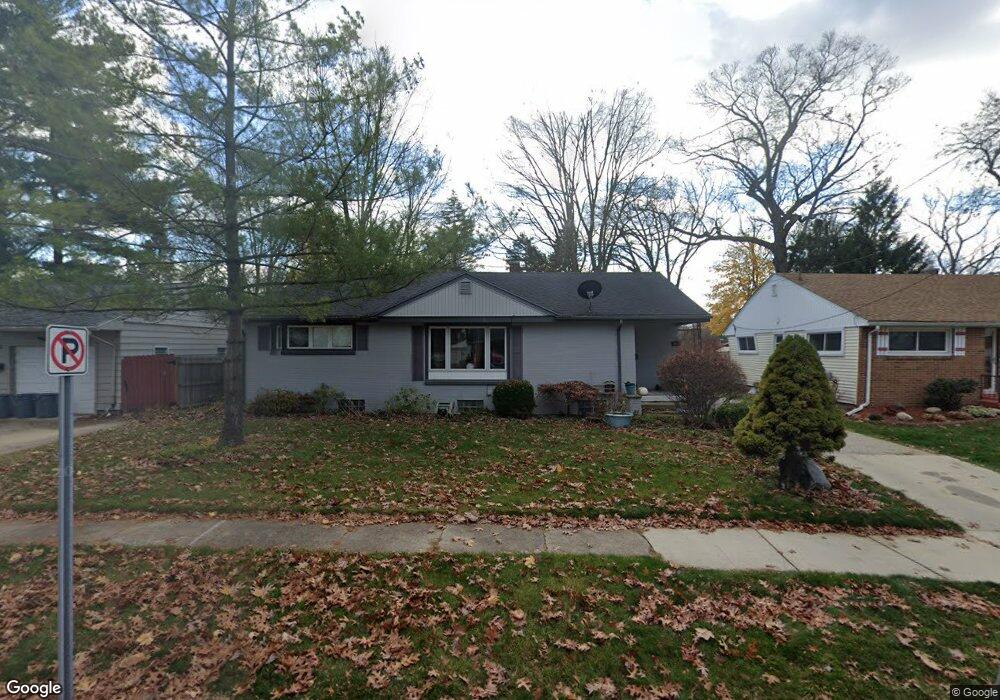
814 Sanborn St Port Huron, MI 48060
Estimated Value: $214,000 - $265,000
3
Beds
2
Baths
1,258
Sq Ft
$187/Sq Ft
Est. Value
About This Home
This home is located at 814 Sanborn St, Port Huron, MI 48060 and is currently estimated at $235,596, approximately $187 per square foot. 814 Sanborn St is a home located in St. Clair County with nearby schools including Garfield Elementary School, Holland Woods Middle School, and Port Huron Northern High School.
Ownership History
Date
Name
Owned For
Owner Type
Purchase Details
Closed on
Apr 16, 2024
Sold by
Weston Megan Marie
Bought by
Weston Joel Christopher
Current Estimated Value
Purchase Details
Closed on
Aug 5, 2013
Sold by
Weston Joel and Priemer Megan M
Bought by
Weston Joel C and Weston Megan M
Home Financials for this Owner
Home Financials are based on the most recent Mortgage that was taken out on this home.
Original Mortgage
$88,800
Interest Rate
4.49%
Mortgage Type
New Conventional
Purchase Details
Closed on
Sep 22, 2011
Sold by
Johnson Clifford S and Jernberg Emily
Bought by
Weston Joel and Priemer Megan M
Home Financials for this Owner
Home Financials are based on the most recent Mortgage that was taken out on this home.
Original Mortgage
$72,720
Interest Rate
4.32%
Mortgage Type
FHA
Create a Home Valuation Report for This Property
The Home Valuation Report is an in-depth analysis detailing your home's value as well as a comparison with similar homes in the area
Home Values in the Area
Average Home Value in this Area
Purchase History
| Date | Buyer | Sale Price | Title Company |
|---|---|---|---|
| Weston Joel Christopher | -- | None Listed On Document | |
| Weston Joel C | -- | None Available | |
| Weston Joel | $90,000 | None Available |
Source: Public Records
Mortgage History
| Date | Status | Borrower | Loan Amount |
|---|---|---|---|
| Previous Owner | Weston Joel C | $88,800 | |
| Previous Owner | Weston Joel | $72,720 |
Source: Public Records
Tax History Compared to Growth
Tax History
| Year | Tax Paid | Tax Assessment Tax Assessment Total Assessment is a certain percentage of the fair market value that is determined by local assessors to be the total taxable value of land and additions on the property. | Land | Improvement |
|---|---|---|---|---|
| 2025 | $2,725 | $104,800 | $0 | $0 |
| 2024 | $2,346 | $98,200 | $0 | $0 |
| 2023 | $2,216 | $86,800 | $0 | $0 |
| 2022 | $2,360 | $77,100 | $0 | $0 |
| 2021 | $2,240 | $72,200 | $0 | $0 |
| 2020 | $2,265 | $69,100 | $69,100 | $0 |
| 2019 | $2,225 | $60,600 | $0 | $0 |
| 2018 | $2,175 | $60,600 | $0 | $0 |
| 2016 | $1,666 | $55,300 | $0 | $0 |
| 2015 | $1,635 | $49,100 | $49,100 | $0 |
| 2014 | $1,635 | $45,600 | $45,600 | $0 |
| 2013 | -- | $44,900 | $0 | $0 |
Source: Public Records
Map
Nearby Homes
- 1020 Sanborn St
- 3321 Stone St
- 3214 Poplar St
- 3455 Gratiot Ave
- 1202 Palmer Ct
- 1424 Hazelwood Ln
- 2913 11th Ave
- 1531 Robinson St
- 1434 Schumaker St
- 1218 Garfield St
- 1116 Hancock St
- 3208 Mount Vernon Rd
- 2419 Cherry St
- 2431 Armour St
- 909 Elmwood St
- 2400 Stone St Unit 2414
- 2835 17th Ave
- 3419 Riverside Dr
- 2812 19th Ave
- 2215 Hancock St