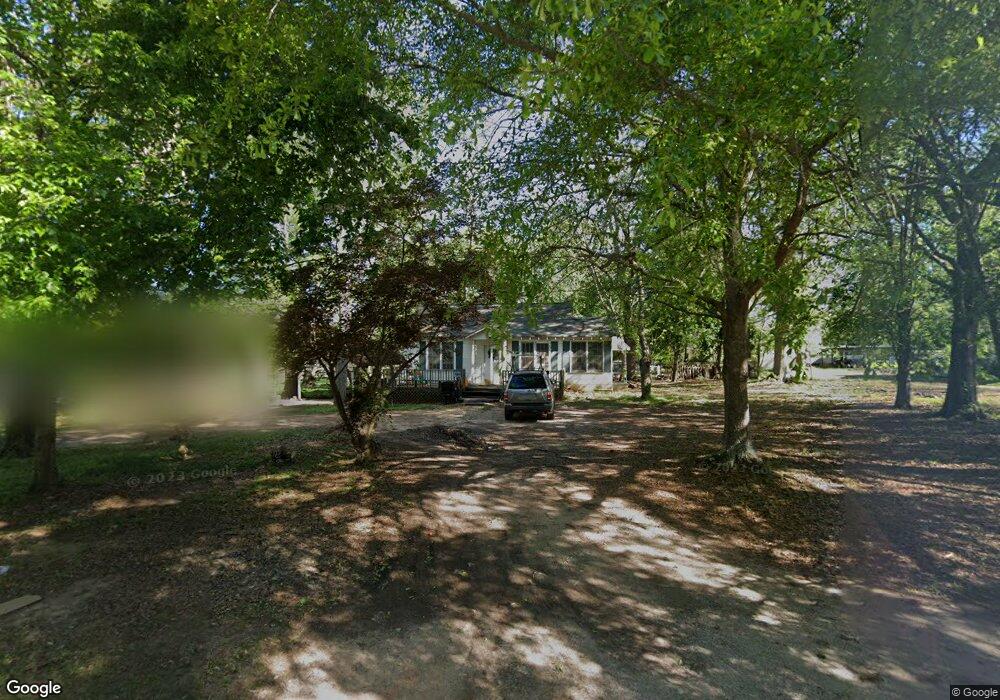
814 Zebulon St Barnesville, GA 30204
Estimated Value: $78,000 - $161,000
3
Beds
1
Bath
1,260
Sq Ft
$87/Sq Ft
Est. Value
About This Home
This home is located at 814 Zebulon St, Barnesville, GA 30204 and is currently estimated at $109,372, approximately $86 per square foot. 814 Zebulon St is a home with nearby schools including Lamar County Primary School, Lamar County Elementary School, and Lamar County Middle School.
Ownership History
Date
Name
Owned For
Owner Type
Purchase Details
Closed on
Feb 26, 2016
Sold by
Mccoy Kenneth F
Bought by
Ivester Robert L and Bales Jennifer
Current Estimated Value
Home Financials for this Owner
Home Financials are based on the most recent Mortgage that was taken out on this home.
Original Mortgage
$27,800
Interest Rate
3.79%
Mortgage Type
New Conventional
Purchase Details
Closed on
Dec 11, 2015
Sold by
Hettermann Cassandra
Bought by
Mccoy Kenneth F and Mccoy Edith
Purchase Details
Closed on
Oct 2, 2012
Sold by
Nixon Brenda Harris
Bought by
Hettermann Cassandra
Purchase Details
Closed on
Jul 31, 2012
Sold by
Posey Johnny J
Bought by
Nixon Brenda Harris
Purchase Details
Closed on
Jul 28, 2012
Sold by
Posey Johnny J
Bought by
Nixon Brenda G and Posey Johnny J
Purchase Details
Closed on
Aug 8, 1963
Bought by
Harris Winnie Mrs
Create a Home Valuation Report for This Property
The Home Valuation Report is an in-depth analysis detailing your home's value as well as a comparison with similar homes in the area
Home Values in the Area
Average Home Value in this Area
Purchase History
| Date | Buyer | Sale Price | Title Company |
|---|---|---|---|
| Ivester Robert L | $27,800 | -- | |
| Mccoy Kenneth F | $20,000 | -- | |
| Hettermann Cassandra | $20,000 | -- | |
| Nixon Brenda Harris | -- | -- | |
| Nixon Brenda G | -- | -- | |
| Harris Winnie Mrs | -- | -- |
Source: Public Records
Mortgage History
| Date | Status | Borrower | Loan Amount |
|---|---|---|---|
| Closed | Ivester Robert L | $27,800 |
Source: Public Records
Tax History Compared to Growth
Tax History
| Year | Tax Paid | Tax Assessment Tax Assessment Total Assessment is a certain percentage of the fair market value that is determined by local assessors to be the total taxable value of land and additions on the property. | Land | Improvement |
|---|---|---|---|---|
| 2025 | $603 | $24,538 | $3,600 | $20,938 |
| 2024 | $603 | $21,038 | $3,600 | $17,438 |
| 2023 | $664 | $21,524 | $3,600 | $17,924 |
| 2022 | $695 | $25,171 | $3,600 | $21,571 |
| 2021 | $608 | $20,218 | $3,600 | $16,618 |
| 2020 | $567 | $17,922 | $3,600 | $14,322 |
| 2019 | $569 | $17,922 | $3,600 | $14,322 |
| 2018 | $433 | $14,224 | $2,680 | $11,544 |
| 2017 | $431 | $14,224 | $2,680 | $11,544 |
| 2016 | $242 | $14,224 | $2,680 | $11,544 |
| 2015 | $431 | $14,224 | $2,680 | $11,544 |
| 2014 | $417 | $14,224 | $2,680 | $11,544 |
| 2013 | -- | $14,224 | $2,680 | $11,544 |
Source: Public Records
Map
Nearby Homes
- 13 Brown St
- 0 Washington Cir
- 420 Zebulon St
- 500 Rose Ave
- 295 Grove St
- 339 Atlanta St
- 245 Atlanta St
- 125 Byrd St
- 531 Thomaston St
- 150 Georgia Ave
- 205 Georgia Ave
- 4 Jackson St
- 0 Mill St Unit 10420113
- 107 1st St
- 250 Mill St
- 303 Carleeta St
- 202 Northside Dr
- 0 Old Milner Rd Unit 10630085
- 101 3rd St
- 0 Veterns Pkwy Unit 10515268
- 812 Zebulon St
- 109 Johnson St
- 0 Johnson (Aka St Unit 124) 10272989
- 0 Johnson (Aka St Unit 125)
- 0 Johnson (Aka #125) St Unit 10273025
- 810 Zebulon St
- 0 Brown St Unit 20148171
- 0 Brown St Unit 7162487
- 0 Brown St Unit 7162489
- 0 Brown St Unit 3141145
- 0 Brown St Unit 8708227
- 0 Brown St Unit 7356378
- 0 Brown St Unit 7356375
- 0 Brown St Unit 7356372
- 0 Brown St Unit 7356369
- 0 Brown St Unit 7356364
- 0 Brown St Unit 7356357
- 0 Brown St Unit 7162502
- 0 Brown St Unit 7162503
- 0 Brown St Unit 7162497