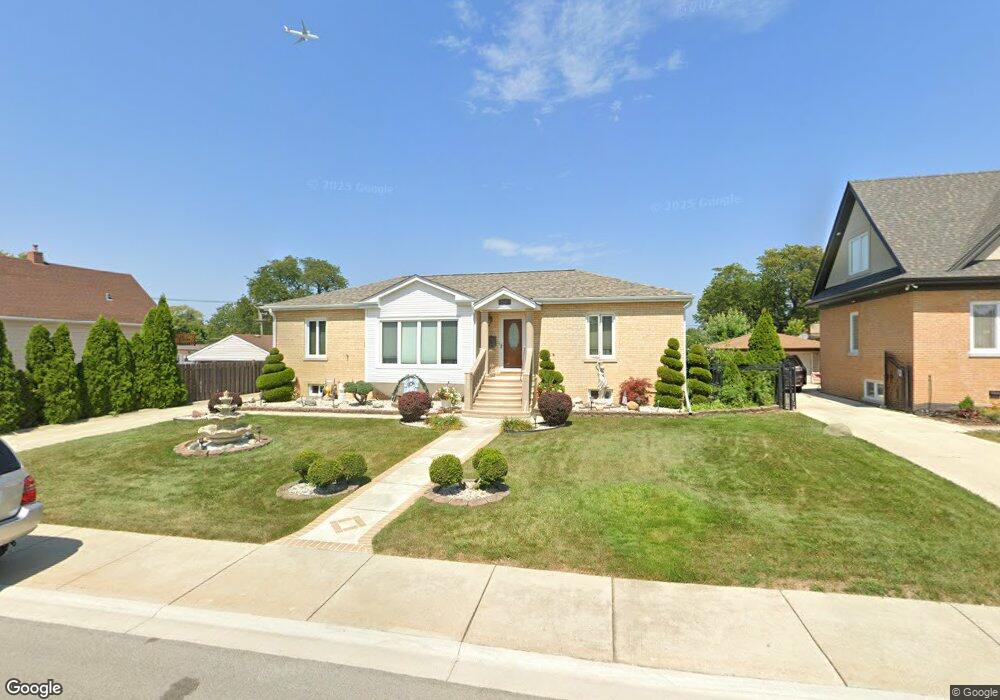
8140 W Winona St Norridge, IL 60706
Estimated Value: $492,000 - $499,186
3
Beds
2
Baths
1,742
Sq Ft
$285/Sq Ft
Est. Value
About This Home
This home is located at 8140 W Winona St, Norridge, IL 60706 and is currently estimated at $496,297, approximately $284 per square foot. 8140 W Winona St is a home located in Cook County with nearby schools including J Leigh Elementary School, Ridgewood Community High School, and St Eugene School.
Ownership History
Date
Name
Owned For
Owner Type
Purchase Details
Closed on
Jun 26, 2012
Sold by
Giannini Diego and Giannini Maria Vita
Bought by
Giannini Diego and Diego Giannini Trust
Current Estimated Value
Purchase Details
Closed on
Sep 5, 2003
Sold by
Defranze Mark and Defranze Amy S
Bought by
Giannini Diego and Giannini Maria Vita
Home Financials for this Owner
Home Financials are based on the most recent Mortgage that was taken out on this home.
Original Mortgage
$312,000
Outstanding Balance
$120,889
Interest Rate
3.87%
Mortgage Type
Unknown
Estimated Equity
$375,408
Purchase Details
Closed on
Jul 31, 2001
Sold by
Parkway Bank & Trust Company
Bought by
Defranze Mark and Defranze Amy S
Home Financials for this Owner
Home Financials are based on the most recent Mortgage that was taken out on this home.
Original Mortgage
$198,400
Interest Rate
7.28%
Purchase Details
Closed on
Oct 8, 1999
Sold by
Capasso Rose
Bought by
Parkway Bank & Trust Company and Trust #12398
Create a Home Valuation Report for This Property
The Home Valuation Report is an in-depth analysis detailing your home's value as well as a comparison with similar homes in the area
Home Values in the Area
Average Home Value in this Area
Purchase History
| Date | Buyer | Sale Price | Title Company |
|---|---|---|---|
| Giannini Diego | -- | None Available | |
| Giannini Diego | $390,000 | -- | |
| Defranze Mark | $248,000 | -- | |
| Parkway Bank & Trust Company | -- | -- |
Source: Public Records
Mortgage History
| Date | Status | Borrower | Loan Amount |
|---|---|---|---|
| Open | Giannini Diego | $312,000 | |
| Previous Owner | Defranze Mark | $198,400 |
Source: Public Records
Tax History Compared to Growth
Tax History
| Year | Tax Paid | Tax Assessment Tax Assessment Total Assessment is a certain percentage of the fair market value that is determined by local assessors to be the total taxable value of land and additions on the property. | Land | Improvement |
|---|---|---|---|---|
| 2024 | $3,486 | $40,000 | $13,060 | $26,940 |
| 2023 | $3,507 | $40,000 | $13,060 | $26,940 |
| 2022 | $3,507 | $40,000 | $13,060 | $26,940 |
| 2021 | $3,865 | $34,566 | $11,552 | $23,014 |
| 2020 | $3,509 | $34,566 | $11,552 | $23,014 |
| 2019 | $3,440 | $38,795 | $11,552 | $27,243 |
| 2018 | $4,004 | $25,726 | $9,543 | $16,183 |
| 2017 | $3,837 | $25,726 | $9,543 | $16,183 |
| 2016 | $2,632 | $25,726 | $9,543 | $16,183 |
| 2015 | $5,595 | $24,592 | $8,287 | $16,305 |
| 2014 | $5,065 | $24,592 | $8,287 | $16,305 |
| 2013 | $5,830 | $27,101 | $8,287 | $18,814 |
Source: Public Records
Map
Nearby Homes
- 8024 W Charmaine Rd
- 4846 N Crescent Ave
- 8231 W Balmoral Ave
- 5161 N Moreland Ave
- 8344 W Catherine Ave
- 5348 N Cumberland Ave Unit 206
- 8500 W Carmen Ave
- 4935 N Frank Pkwy
- 8021 W Rascher Ave
- 8517 W Carmen Ave
- 8268 W Lawrence Ave
- 8540 W Foster Ave Unit 605
- 8540 W Foster Ave Unit 504
- 8542 W Winnemac Ave
- 7809 W Farragut Ave
- 7805 W Farragut Ave
- 5323 N Delphia Ave Unit 323
- 5349 N Delphia Ave Unit 250
- 5349 N Delphia Ave Unit 150
- 8025 W Giddings St
- 8144 W Winona St
- 8136 W Winona St
- 8147 W Memory Ln
- 8132 W Winona St
- 8141 W Memory Ln
- 5150 N Pittsburgh Ave
- 5140 N Pittsburgh Ave
- 8141 W Winona St
- 8145 W Winona St
- 5160 N Pittsburgh Ave
- 8137 W Winona St
- 8128 W Winona St
- 8151 W Memory Ln
- 5130 N Pittsburgh Ave
- 8133 W Memory Ln
- 5170 N Pittsburgh Ave
- 5120 N Pittsburgh Ave
- 5180 N Pittsburgh Ave
- 8124 W Winona St
- 8125 W Memory Ln