Estimated Value: $624,000 - $836,000
4
Beds
2
Baths
1,719
Sq Ft
$428/Sq Ft
Est. Value
About This Home
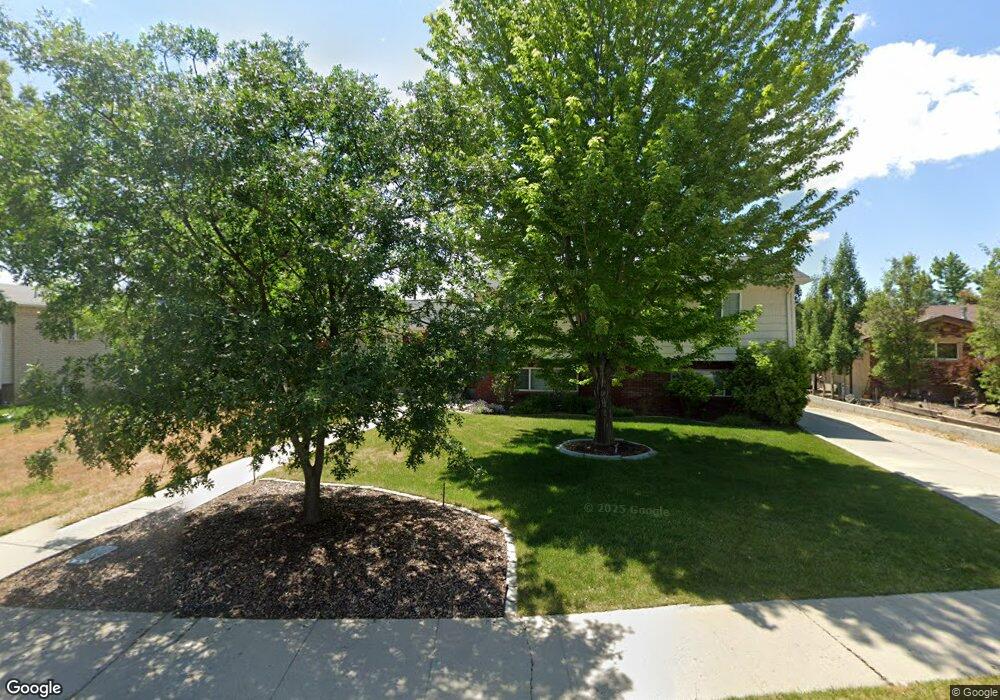
This home is located at 8140 Willow Stream Dr, Sandy, UT 84093 and is currently estimated at $735,183, approximately $427 per square foot. 8140 Willow Stream Dr is a home located in Salt Lake County with nearby schools including Brookwood Elementary School, Albion Middle School, and Brighton High School.
Ownership History
Date
Name
Owned For
Owner Type
Purchase Details
Closed on
Aug 25, 2021
Sold by
Benson Stephen K and Benson Trina H
Bought by
Nielson Jillian Michele and Jensen Tyler Aksel
Current Estimated Value
Home Financials for this Owner
Home Financials are based on the most recent Mortgage that was taken out on this home.
Original Mortgage
$350,000
Outstanding Balance
$318,474
Interest Rate
2.8%
Mortgage Type
New Conventional
Estimated Equity
$416,709
Purchase Details
Closed on
Apr 20, 2021
Sold by
Benson Stephen K and The Benson Family Trust
Bought by
Benson Stephen K and Benson Trina H
Purchase Details
Closed on
Sep 9, 2011
Sold by
Benson Stephen K
Bought by
Benson Stephen K and The Benson Family Trust
Purchase Details
Closed on
Dec 4, 2003
Sold by
Allen Susan Lynn Peterson
Bought by
Benson Stephen K and The Benson Family Trust
Purchase Details
Closed on
Jul 23, 2001
Sold by
Peterson Geraldine Siddoway
Bought by
Peterson Geraldine Siddoway and Geraldine Siddoway Peterson Revocable Tr
Create a Home Valuation Report for This Property
The Home Valuation Report is an in-depth analysis detailing your home's value as well as a comparison with similar homes in the area
Home Values in the Area
Average Home Value in this Area
Purchase History
| Date | Buyer | Sale Price | Title Company |
|---|---|---|---|
| Nielson Jillian Michele | -- | Metro National Title | |
| Benson Stephen K | -- | None Available | |
| Benson Stephen K | -- | Richland Title Ins Agency In | |
| Benson Stephen K | -- | Metro National Title | |
| Peterson Geraldine Siddoway | -- | -- |
Source: Public Records
Mortgage History
| Date | Status | Borrower | Loan Amount |
|---|---|---|---|
| Open | Nielson Jillian Michele | $350,000 |
Source: Public Records
Tax History
| Year | Tax Paid | Tax Assessment Tax Assessment Total Assessment is a certain percentage of the fair market value that is determined by local assessors to be the total taxable value of land and additions on the property. | Land | Improvement |
|---|---|---|---|---|
| 2025 | $3,470 | $672,200 | $292,000 | $380,200 |
| 2024 | $3,470 | $663,400 | $281,100 | $382,300 |
| 2023 | $2,912 | $542,800 | $270,300 | $272,500 |
| 2022 | $3,413 | $597,800 | $265,000 | $332,800 |
| 2021 | $3,242 | $501,700 | $203,200 | $298,500 |
| 2020 | $2,842 | $414,900 | $203,200 | $211,700 |
| 2019 | $2,755 | $391,700 | $191,800 | $199,900 |
| 2016 | $2,213 | $305,100 | $172,800 | $132,300 |
Source: Public Records
Map
Nearby Homes
- 2152 E Creek Rd
- 2161 E Lorita Way
- 8266 S Creek Hollow Cove
- 2238 Cottonwood Cove Ln
- 8122 S Willow Creek Cove
- 8483 Terrace Dr
- 1990 E Terra Vista Way
- 1924 E Viscounti Cove
- 1627 E Mulberry Way
- 2614 E Tuxedo Cir
- 2407 Bengal Bend Cove
- 8638 Piper Ln
- 8492 S Mesa Dr
- 1997 E Parkridge Dr
- 7462 S 2300 E
- 2110 Lonsdale Dr
- 8585 Mount Majestic Rd
- 2670 Bridger Blvd Unit 8
- 8597 Mount Majestic Rd
- 7609 S 2700 E
- 8126 Willow Stream Dr
- 8154 Willow Stream Dr
- 8139 Spectrum Cove
- 8139 S Spectrum Cove
- 8139 S Spectrum Cove Unit Lot 5
- 8157 S Spectrum Cove
- 8157 Spectrum Cove
- 8112 Willow Stream Dr
- 8112 S Willow Stream Dr
- 8123 S Spectrum Cove Unit Lot 4
- 8123 S Spectrum Cove
- 8123 Spectrum Cove
- 2121 Creek Way
- 8172 S Willow Stream Dr
- 8172 Willow Stream Dr
- 2095 Creek Rd
- 2079 E Creek Rd Unit 7
- 2126 Creek Way
- 2079 Creek Rd
- 8105 Willow Stream Dr
Your Personal Tour Guide
Ask me questions while you tour the home.