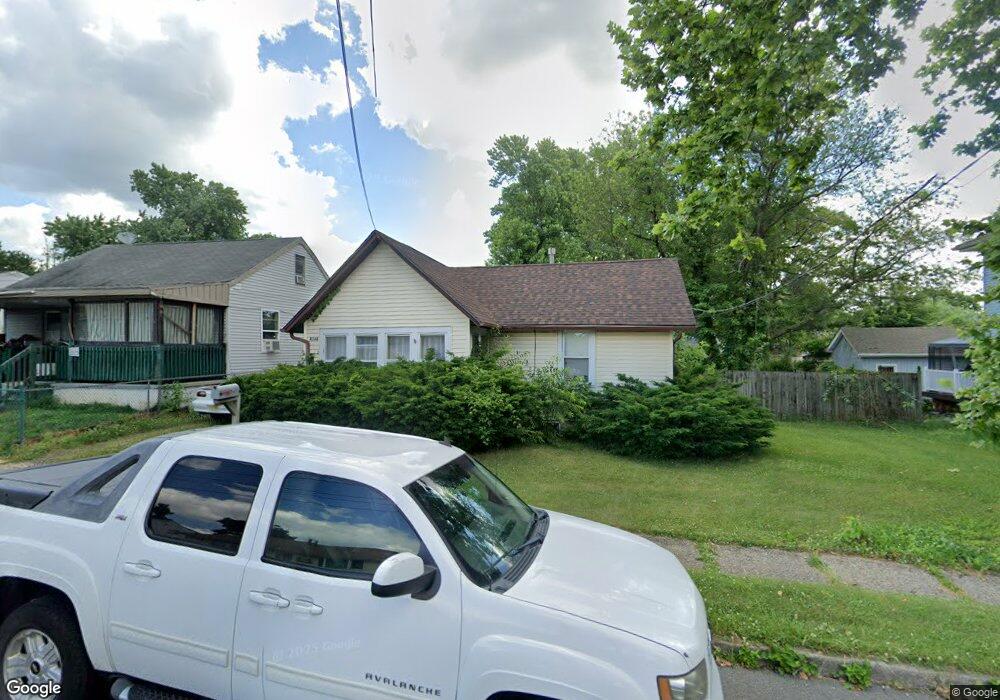
8144 Day Ave Pennsauken, NJ 08110
Estimated Value: $150,000 - $288,000
--
Bed
--
Bath
904
Sq Ft
$246/Sq Ft
Est. Value
About This Home
This home is located at 8144 Day Ave, Pennsauken, NJ 08110 and is currently estimated at $222,058, approximately $245 per square foot. 8144 Day Ave is a home located in Camden County with nearby schools including Pennsauken High School and St. Cecilia School.
Ownership History
Date
Name
Owned For
Owner Type
Purchase Details
Closed on
Oct 30, 2024
Sold by
Lusch Carl and Lusch Christopher N
Bought by
Mesa Fabio
Current Estimated Value
Purchase Details
Closed on
Jan 26, 2012
Sold by
Lusch Robin E
Bought by
Lusch Carl
Purchase Details
Closed on
Oct 26, 2001
Sold by
Duffy Carol A
Bought by
Lusch Robin E
Home Financials for this Owner
Home Financials are based on the most recent Mortgage that was taken out on this home.
Original Mortgage
$71,250
Interest Rate
7.01%
Purchase Details
Closed on
Jun 21, 1994
Sold by
Federal Housing Administration
Bought by
Duffy Carol
Home Financials for this Owner
Home Financials are based on the most recent Mortgage that was taken out on this home.
Original Mortgage
$56,000
Interest Rate
8.19%
Mortgage Type
FHA
Create a Home Valuation Report for This Property
The Home Valuation Report is an in-depth analysis detailing your home's value as well as a comparison with similar homes in the area
Home Values in the Area
Average Home Value in this Area
Purchase History
| Date | Buyer | Sale Price | Title Company |
|---|---|---|---|
| Mesa Fabio | $145,000 | Brennan Title | |
| Mesa Fabio | $145,000 | Brennan Title | |
| Lusch Carl | -- | -- | |
| Lusch Robin E | $75,000 | -- | |
| Duffy Carol | $43,000 | -- |
Source: Public Records
Mortgage History
| Date | Status | Borrower | Loan Amount |
|---|---|---|---|
| Previous Owner | Lusch Robin E | $71,250 | |
| Previous Owner | Duffy Carol | $56,000 |
Source: Public Records
Tax History Compared to Growth
Tax History
| Year | Tax Paid | Tax Assessment Tax Assessment Total Assessment is a certain percentage of the fair market value that is determined by local assessors to be the total taxable value of land and additions on the property. | Land | Improvement |
|---|---|---|---|---|
| 2025 | $4,060 | $226,900 | $58,500 | $168,400 |
| 2024 | $3,982 | $93,300 | $38,900 | $54,400 |
| 2023 | $3,982 | $93,300 | $38,900 | $54,400 |
| 2022 | $3,600 | $93,300 | $38,900 | $54,400 |
| 2021 | $3,697 | $93,300 | $38,900 | $54,400 |
| 2020 | $3,312 | $93,300 | $38,900 | $54,400 |
| 2019 | $3,350 | $93,300 | $38,900 | $54,400 |
| 2018 | $3,368 | $93,300 | $38,900 | $54,400 |
| 2017 | $3,375 | $93,300 | $38,900 | $54,400 |
| 2016 | $3,314 | $93,300 | $38,900 | $54,400 |
| 2015 | $3,413 | $93,300 | $38,900 | $54,400 |
| 2014 | $3,304 | $59,400 | $22,600 | $36,800 |
Source: Public Records
Map
Nearby Homes
- 7924 River Rd
- 8249 Eden Ln
- 503 Delair Ave
- 457 Delair Ave
- 8444 Holman Ave
- 7529 River Rd
- 7521 River Rd
- 7525 Forrest Ave
- 437 Velde Ave
- 1505 Velde Ave
- 7318 Zimmerman Ave
- 7515 Baxter Ave
- 2410 Shelley Ln
- 7426 Wyndam Rd
- 7403 Grant Ave
- 2603 Manall Ave
- 2543 Burning Tree Rd
- 2602 Foehl Ave
- 6116 Pleasant Ave
- 1765 Hillcrest Ave