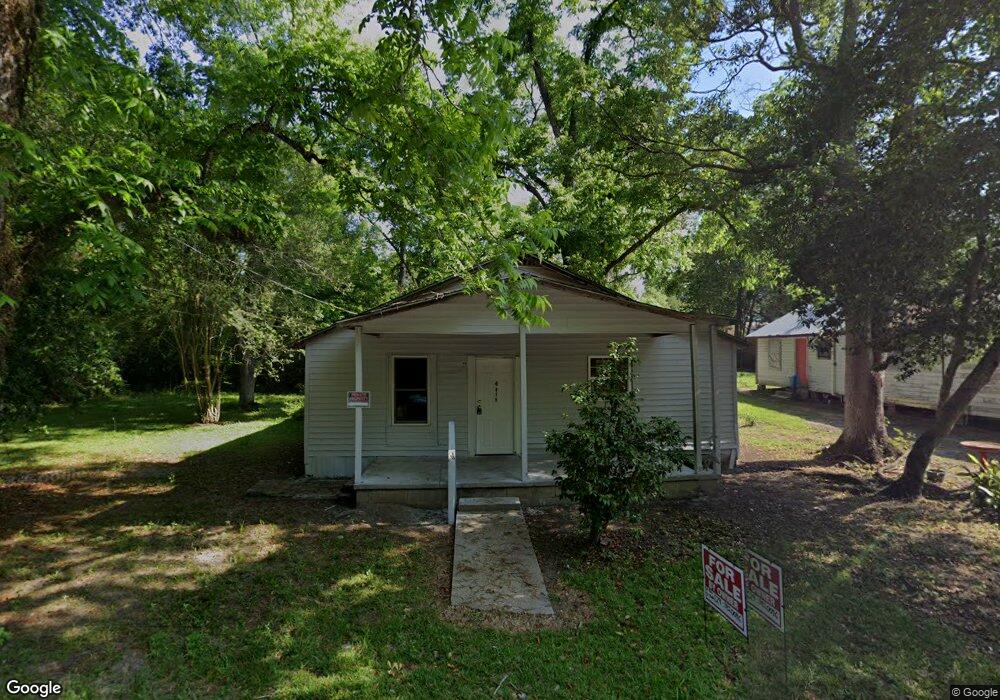
815 9th Ave SE Moultrie, GA 31768
Estimated Value: $57,000 - $130,000
Studio
1
Bath
1,052
Sq Ft
$84/Sq Ft
Est. Value
About This Home
This home is located at 815 9th Ave SE, Moultrie, GA 31768 and is currently estimated at $88,472, approximately $84 per square foot. 815 9th Ave SE is a home located in Colquitt County with nearby schools including Cox Elementary School, Willie J. Williams Middle School, and C.A. Gray Junior High School.
Ownership History
Date
Name
Owned For
Owner Type
Purchase Details
Closed on
Jun 23, 2023
Sold by
Cabanas Avalos Esther Inocenci
Bought by
Alvarez Onelia D Covas and Igarza Roberto
Current Estimated Value
Purchase Details
Closed on
Sep 12, 2016
Sold by
Castro Juan
Bought by
Cabanas Avalos Esther Inocenci
Purchase Details
Closed on
Jun 26, 2014
Sold by
Purvis Joshua S
Bought by
Ovalle Juan Castro
Purchase Details
Closed on
Jul 7, 2011
Sold by
Folsom Mark
Bought by
Purvus Joshua S
Home Financials for this Owner
Home Financials are based on the most recent Mortgage that was taken out on this home.
Original Mortgage
$10,880
Interest Rate
4.52%
Mortgage Type
Future Advance Clause Open End Mortgage
Purchase Details
Closed on
Sep 21, 2004
Sold by
Purvis Ricky
Bought by
Folsom Mark
Purchase Details
Closed on
Sep 1, 1998
Bought by
Purvis Ricky
Purchase Details
Closed on
Jul 30, 1998
Bought by
1St Franklin Financial C
Purchase Details
Closed on
Aug 30, 1996
Bought by
Howard Debra Elaine
Create a Home Valuation Report for This Property
The Home Valuation Report is an in-depth analysis detailing your home's value as well as a comparison with similar homes in the area
Purchase History
| Date | Buyer | Sale Price | Title Company |
|---|---|---|---|
| Alvarez Onelia D Covas | -- | -- | |
| Cabanas Avalos Esther Inocenci | $6,000 | -- | |
| Ovalle Juan Castro | $6,500 | -- | |
| Purvus Joshua S | $10,000 | -- | |
| Folsom Mark | $11,300 | -- | |
| Purvis Ricky | $10,500 | -- | |
| 1St Franklin Financial C | $9,100 | -- | |
| Howard Debra Elaine | $1,500 | -- |
Source: Public Records
Mortgage History
| Date | Status | Borrower | Loan Amount |
|---|---|---|---|
| Previous Owner | Purvus Joshua S | $10,880 |
Source: Public Records
Tax History
| Year | Tax Paid | Tax Assessment Tax Assessment Total Assessment is a certain percentage of the fair market value that is determined by local assessors to be the total taxable value of land and additions on the property. | Land | Improvement |
|---|---|---|---|---|
| 2025 | $523 | $10,163 | $1,736 | $8,427 |
| 2024 | $523 | $10,054 | $1,736 | $8,318 |
| 2023 | $496 | $4,908 | $1,736 | $3,172 |
| 2022 | $151 | $4,520 | $1,736 | $2,784 |
| 2021 | $148 | $4,370 | $1,736 | $2,634 |
| 2020 | $140 | $4,046 | $1,736 | $2,310 |
| 2019 | $157 | $4,046 | $1,736 | $2,310 |
| 2018 | $162 | $4,046 | $1,736 | $2,310 |
| 2017 | $92 | $4,046 | $1,736 | $2,310 |
| 2016 | $256 | $6,414 | $1,736 | $4,678 |
| 2015 | $104 | $6,414 | $1,736 | $4,678 |
| 2014 | $199 | $4,859 | $1,736 | $3,123 |
| 2013 | -- | $4,859 | $1,736 | $3,123 |
Source: Public Records
Map
Nearby Homes
- 6 SE Pheasant Ln
- 608 7th Ave SE
- 1013 6th Ave SE
- 717 5th Ave SE
- 1117 11th Ave SE
- 521 5th Ave SE Unit 4
- 515 5th Ave SE Unit 4
- 621 3rd St SE
- 308 Hillcrest Ave
- 902 2nd St SE
- 922 1st St SE
- 407 1st Ave SE
- 720 S Main St
- 3 5th St SE
- 2 5th St SE
- 1 5th St SE
- 4 5th St SE
- 220 Dixie Dr
- 40 SE Packer Pride Dr Unit 135
- 40 SE Packer Pride Dr
- 819 9th Ave SE
- 812 8th Ave SE
- 819 8th St SE
- 804 8th Ave SE
- 823 9th Ave SE
- 802 8th Ave SE
- 824 8th Ave SE
- 800 8th Ave SE
- 822 9th Ave SE
- 9 SE Pheasant Ln
- 9 SE Pheasant Ln
- 901 9th Ave SE
- 901 1/2 9th Ave SE
- 909 8th St SE
- 900 8th Ave SE
- 807 8th Ave SE
- 811 8th Ave SE
- 805 8th Ave SE
- 720 9th Ave SE
- 817 8th Ave SE
Your Personal Tour Guide
Ask me questions while you tour the home.