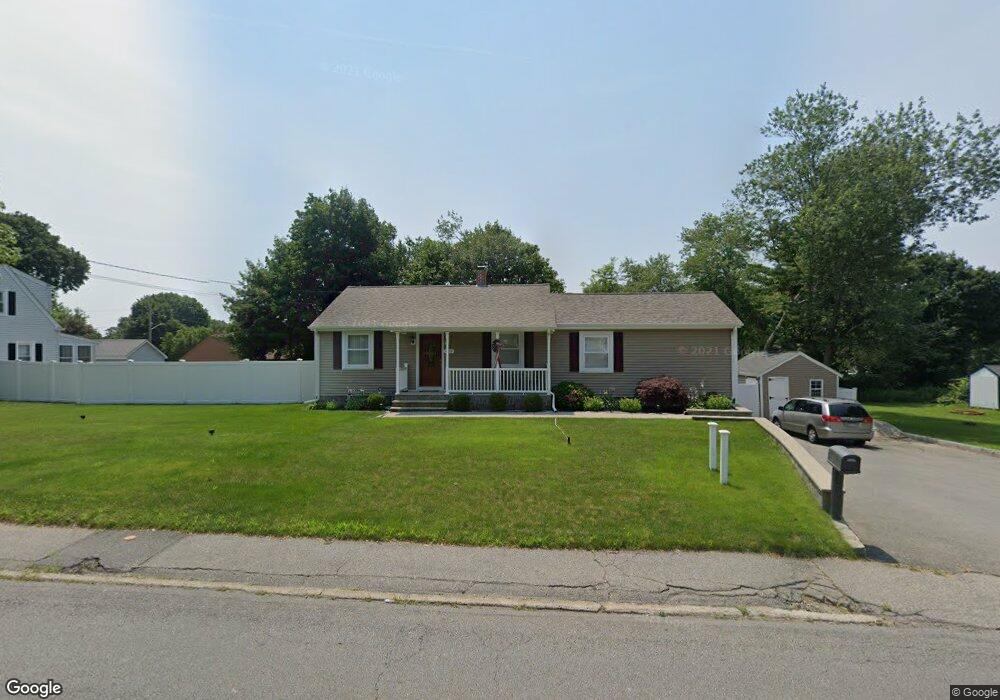
815 Buffinton St Somerset, MA 02726
Pottersville NeighborhoodEstimated Value: $480,031 - $487,000
3
Beds
2
Baths
1,366
Sq Ft
$353/Sq Ft
Est. Value
About This Home
This home is located at 815 Buffinton St, Somerset, MA 02726 and is currently estimated at $482,258, approximately $353 per square foot. 815 Buffinton St is a home located in Bristol County with nearby schools including Chace Street School, Somerset Middle School, and Swansea Wood School.
Ownership History
Date
Name
Owned For
Owner Type
Purchase Details
Closed on
Nov 22, 2010
Sold by
Norman Judith and Landry Judith Ann
Bought by
Daponte George and Daponte Zelia M
Current Estimated Value
Home Financials for this Owner
Home Financials are based on the most recent Mortgage that was taken out on this home.
Original Mortgage
$136,000
Outstanding Balance
$89,165
Interest Rate
4.3%
Mortgage Type
Purchase Money Mortgage
Estimated Equity
$393,093
Create a Home Valuation Report for This Property
The Home Valuation Report is an in-depth analysis detailing your home's value as well as a comparison with similar homes in the area
Home Values in the Area
Average Home Value in this Area
Purchase History
| Date | Buyer | Sale Price | Title Company |
|---|---|---|---|
| Daponte George | $170,000 | -- | |
| Daponte George | $170,000 | -- |
Source: Public Records
Mortgage History
| Date | Status | Borrower | Loan Amount |
|---|---|---|---|
| Open | Daponte George | $136,000 | |
| Closed | Daponte George | $136,000 |
Source: Public Records
Tax History
| Year | Tax Paid | Tax Assessment Tax Assessment Total Assessment is a certain percentage of the fair market value that is determined by local assessors to be the total taxable value of land and additions on the property. | Land | Improvement |
|---|---|---|---|---|
| 2025 | $5,437 | $408,800 | $181,400 | $227,400 |
| 2024 | $5,073 | $396,600 | $181,400 | $215,200 |
| 2023 | $4,435 | $349,800 | $157,600 | $192,200 |
| 2022 | $4,096 | $308,200 | $136,200 | $172,000 |
| 2021 | $4,131 | $281,400 | $123,200 | $158,200 |
| 2020 | $4,036 | $265,200 | $123,300 | $141,900 |
| 2019 | $4,603 | $252,200 | $123,300 | $128,900 |
| 2018 | $3,974 | $234,300 | $119,600 | $114,700 |
| 2017 | $3,880 | $223,000 | $114,100 | $108,900 |
| 2016 | $3,905 | $223,000 | $114,100 | $108,900 |
| 2015 | $3,670 | $211,500 | $108,900 | $102,600 |
| 2014 | $4,972 | $205,900 | $105,800 | $100,100 |
Source: Public Records
Map
Nearby Homes
- 46 Lilac Ave
- 0 Bark St Unit 1342599
- 0 Bark St Unit 73152576
- 54 Grant Ave
- 210 Harrison Ave
- 745 Bark St
- 2714 Riverside Ave
- 125 George St
- 300 Read St
- 33 Rhinecliffe Rd
- 34 Doherty Ave
- 1553 Riverside Ave
- 1496 Riverside Ave
- 30 Tennyson Dr
- 35 Randall Ave
- 60 Aetna St
- 145 Mount Hope Rd
- 1174 Riverside Ave
- 131 Chateau Dr
- 197 Alberta Ave
- 785 Buffinton St
- 828 Buffinton St
- 92 Lilac Ave
- 835 Buffinton St
- 84 Lilac Ave
- 859 Buffinton St
- 7 Violet Ave
- 24 Hinchey Ln
- 794 Buffinton St
- 15 Hinchey Ln
- 767 Buffinton St
- 770 Buffinton St
- 759 Buffinton St
- 103 Lilac Ave
- 101 Ivy Ave
- 754 Buffinton St
- 747 Buffinton St
- 69 Lilac Ave
- 115 Lilac Ave
- 14 Fatima Dr
Your Personal Tour Guide
Ask me questions while you tour the home.