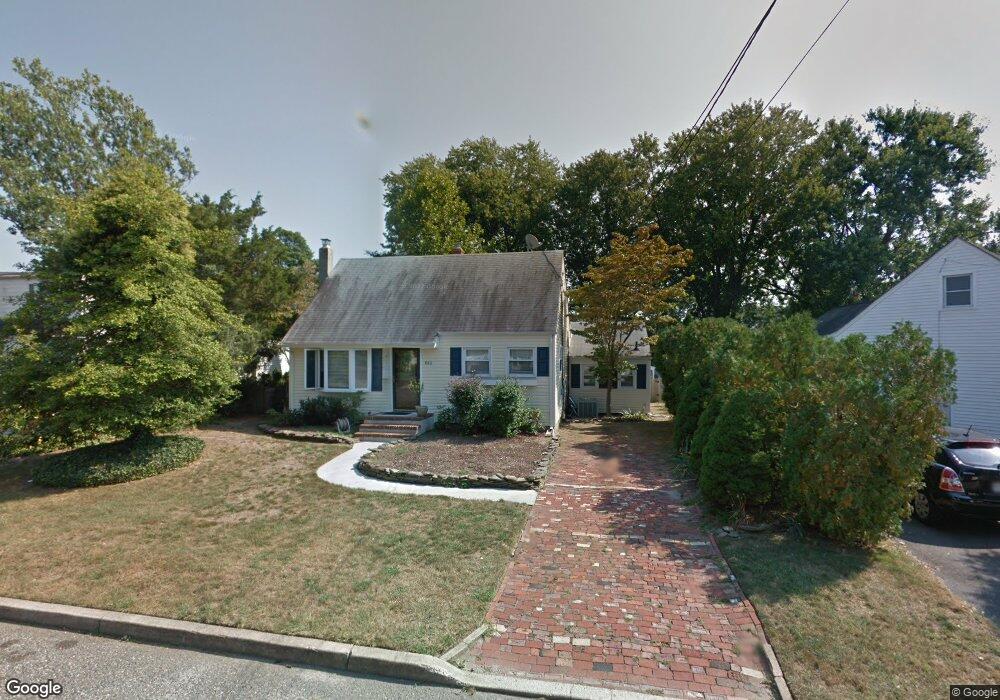
815 Claridge Dr Spring Lake, NJ 07762
Estimated Value: $753,000 - $1,095,046
2
Beds
2
Baths
1,496
Sq Ft
$648/Sq Ft
Est. Value
About This Home
This home is located at 815 Claridge Dr, Spring Lake, NJ 07762 and is currently estimated at $968,762, approximately $647 per square foot. 815 Claridge Dr is a home located in Monmouth County with nearby schools including Spring Lake Heights Elementary School and St. Catharine School.
Ownership History
Date
Name
Owned For
Owner Type
Purchase Details
Closed on
Jun 6, 2014
Sold by
Getrick Kevin D
Bought by
Mencel Charles and Mencel Rebecca
Current Estimated Value
Home Financials for this Owner
Home Financials are based on the most recent Mortgage that was taken out on this home.
Original Mortgage
$316,800
Outstanding Balance
$241,056
Interest Rate
4.21%
Mortgage Type
New Conventional
Estimated Equity
$727,706
Purchase Details
Closed on
Sep 11, 2003
Sold by
Fallon Daniel
Bought by
Mcgetrick Kevin
Home Financials for this Owner
Home Financials are based on the most recent Mortgage that was taken out on this home.
Original Mortgage
$312,000
Interest Rate
5.98%
Purchase Details
Closed on
Apr 23, 1998
Sold by
Barcus John
Bought by
Fallon Daniel and Fallon Cassie
Home Financials for this Owner
Home Financials are based on the most recent Mortgage that was taken out on this home.
Original Mortgage
$144,000
Interest Rate
7.03%
Create a Home Valuation Report for This Property
The Home Valuation Report is an in-depth analysis detailing your home's value as well as a comparison with similar homes in the area
Home Values in the Area
Average Home Value in this Area
Purchase History
| Date | Buyer | Sale Price | Title Company |
|---|---|---|---|
| Mencel Charles | $396,000 | Agent For Old Republic Natl | |
| Mcgetrick Kevin | $390,000 | -- | |
| Fallon Daniel | $179,900 | -- |
Source: Public Records
Mortgage History
| Date | Status | Borrower | Loan Amount |
|---|---|---|---|
| Open | Mencel Charles | $316,800 | |
| Previous Owner | Mcgetrick Kevin | $312,000 | |
| Previous Owner | Fallon Daniel | $144,000 |
Source: Public Records
Tax History
| Year | Tax Paid | Tax Assessment Tax Assessment Total Assessment is a certain percentage of the fair market value that is determined by local assessors to be the total taxable value of land and additions on the property. | Land | Improvement |
|---|---|---|---|---|
| 2025 | $7,772 | $798,000 | $611,400 | $186,600 |
| 2024 | $7,075 | $738,100 | $536,900 | $201,200 |
| 2023 | $7,075 | $631,700 | $434,600 | $197,100 |
| 2022 | $6,257 | $524,400 | $345,600 | $178,800 |
| 2021 | $6,091 | $463,500 | $301,000 | $162,500 |
| 2020 | $6,091 | $448,500 | $301,000 | $147,500 |
| 2019 | $6,097 | $444,400 | $301,000 | $143,400 |
| 2018 | $6,112 | $433,500 | $301,000 | $132,500 |
| 2017 | $5,874 | $431,900 | $301,000 | $130,900 |
| 2016 | $5,924 | $430,200 | $301,000 | $129,200 |
| 2015 | $5,861 | $426,900 | $301,000 | $125,900 |
| 2014 | $5,721 | $426,000 | $301,000 | $125,000 |
Source: Public Records
Map
Nearby Homes
- 815 Woodcrest Dr
- 809 Wall Rd
- 23 Locust Way
- 16 Cherry Ct
- 2419 Kipling Ave
- 420 Ludlow Ave
- 1838 State Route 35 Unit 10
- 27 Apple Dr
- 217 Pitney Ave
- 513 Mercer Ave
- 1726 M St
- 1731 Grove St
- 207 Tuttle Ave
- 2208 2nd Ave
- 206 Brighton Ave
- 604 Monmouth Ave
- 1210 Xanadu Ln Unit A1210
- 2005 Nassau Dr
- 117 Madison Ave
- 1805 Margerum Ave
- 817 Claridge Dr
- 814 Greenwood Dr
- 811 Claridge Dr
- 812 Greenwood Dr
- 816 Greenwood Dr
- 814 Claridge Dr
- 810 Greenwood Dr
- 812 Claridge Dr
- 812 Claridge Dr Unit SUMMER
- 816 Claridge Dr
- 809 Claridge Dr
- 2103 Windsor Terrace
- 810 Claridge Dr
- 808 Greenwood Dr
- 900 Greenwood Dr
- 807 Claridge Dr
- 808 Claridge Dr
- 903 Claridge Dr
- 2201 Windsor Terrace
- 806 Greenwood Dr
Your Personal Tour Guide
Ask me questions while you tour the home.