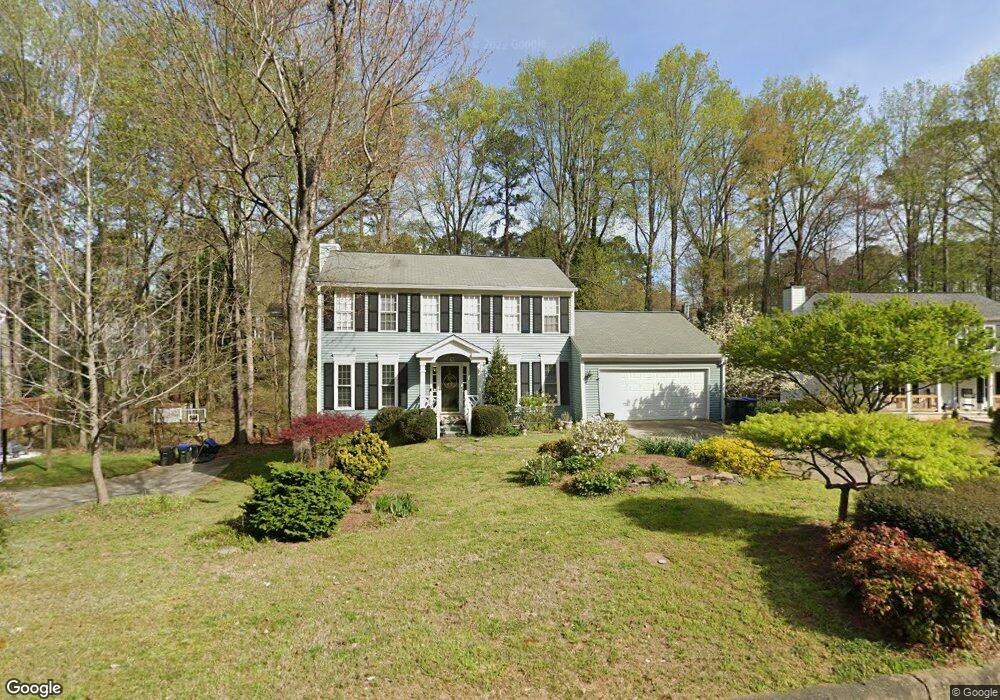
815 Crab Orchard Dr Unit 6 Roswell, GA 30076
Barrington NeighborhoodEstimated Value: $480,000 - $490,000
4
Beds
3
Baths
1,632
Sq Ft
$297/Sq Ft
Est. Value
About This Home
This home is located at 815 Crab Orchard Dr Unit 6, Roswell, GA 30076 and is currently estimated at $484,909, approximately $297 per square foot. 815 Crab Orchard Dr Unit 6 is a home located in Fulton County with nearby schools including Northwood Elementary School, Haynes Bridge Middle School, and Centennial High School.
Ownership History
Date
Name
Owned For
Owner Type
Purchase Details
Closed on
Nov 29, 2001
Sold by
Rhoads Michael
Bought by
Shea Peter A and Shea Ellen H
Current Estimated Value
Home Financials for this Owner
Home Financials are based on the most recent Mortgage that was taken out on this home.
Original Mortgage
$184,900
Interest Rate
6.6%
Mortgage Type
New Conventional
Purchase Details
Closed on
Aug 10, 2001
Sold by
Garrett Thomas C and Garrett Winifred B
Bought by
Rhoads Michael
Home Financials for this Owner
Home Financials are based on the most recent Mortgage that was taken out on this home.
Original Mortgage
$135,000
Interest Rate
7.19%
Mortgage Type
New Conventional
Purchase Details
Closed on
Aug 20, 1993
Sold by
Lannan Gary J Jennifer J
Bought by
Garrett Thomas C Winifred
Home Financials for this Owner
Home Financials are based on the most recent Mortgage that was taken out on this home.
Original Mortgage
$106,500
Interest Rate
7.22%
Mortgage Type
FHA
Create a Home Valuation Report for This Property
The Home Valuation Report is an in-depth analysis detailing your home's value as well as a comparison with similar homes in the area
Home Values in the Area
Average Home Value in this Area
Purchase History
| Date | Buyer | Sale Price | Title Company |
|---|---|---|---|
| Shea Peter A | $184,900 | -- | |
| Rhoads Michael | $150,000 | -- | |
| Garrett Thomas C Winifred | $107,000 | -- |
Source: Public Records
Mortgage History
| Date | Status | Borrower | Loan Amount |
|---|---|---|---|
| Closed | Shea Peter A | $184,900 | |
| Previous Owner | Rhoads Michael | $135,000 | |
| Previous Owner | Garrett Thomas C Winifred | $106,500 |
Source: Public Records
Tax History Compared to Growth
Tax History
| Year | Tax Paid | Tax Assessment Tax Assessment Total Assessment is a certain percentage of the fair market value that is determined by local assessors to be the total taxable value of land and additions on the property. | Land | Improvement |
|---|---|---|---|---|
| 2025 | $505 | $157,760 | $39,720 | $118,040 |
| 2023 | $4,541 | $160,880 | $40,480 | $120,400 |
| 2022 | $1,925 | $139,480 | $25,600 | $113,880 |
| 2021 | $2,292 | $117,840 | $29,160 | $88,680 |
| 2020 | $2,324 | $111,120 | $27,320 | $83,800 |
| 2019 | $393 | $109,160 | $26,840 | $82,320 |
| 2018 | $2,287 | $100,240 | $20,000 | $80,240 |
| 2017 | $1,827 | $74,560 | $12,680 | $61,880 |
| 2016 | $1,825 | $74,560 | $12,680 | $61,880 |
| 2015 | $2,239 | $74,560 | $12,680 | $61,880 |
| 2014 | $1,895 | $74,560 | $12,680 | $61,880 |
Source: Public Records
Map
Nearby Homes
- 295 Crab Orchard Way
- 780 Crab Orchard Dr
- 600 Jardin Ct Unit 48
- 500 Barrington Dr W
- 2020 Jardin Ct Unit 1
- 435 Sheringham Terrace
- 590 Sheringham Ct
- 485 Sheringham Ct
- 105 Laurel Mill Ct
- 680 Barrington Way
- 515 Forest Place
- 650 Lake Forest Ct
- 620 Lake Forest Ct
- 105 May Glen Way
- 1095 Northpointe Trace
- 9985 Lake Forest Way
- 115 Ansley Ct
- 10280 Crescent Ridge Dr
- 825 Crab Orchard Dr
- 805 Crab Orchard Dr
- 995 Cranberry Creek
- 985 Cranberry Creek Unit 10
- 0 Crab Orchard Dr Unit 7164220
- 0 Crab Orchard Dr Unit 7297849
- 0 Crab Orchard Dr Unit 7513533
- 0 Crab Orchard Dr Unit 7326978
- 0 Crab Orchard Dr Unit 7316635
- 0 Crab Orchard Dr Unit 7117308
- 0 Crab Orchard Dr Unit 8882294
- 0 Crab Orchard Dr Unit 8498329
- 0 Crab Orchard Dr Unit 8039806
- 0 Crab Orchard Dr Unit 8744201
- 0 Crab Orchard Dr Unit 3163634
- 0 Crab Orchard Dr
- 835 Crab Orchard Dr Unit 6
- 1005 Cranberry Creek
- 795 Crab Orchard Dr
- 800 Crab Orchard Dr