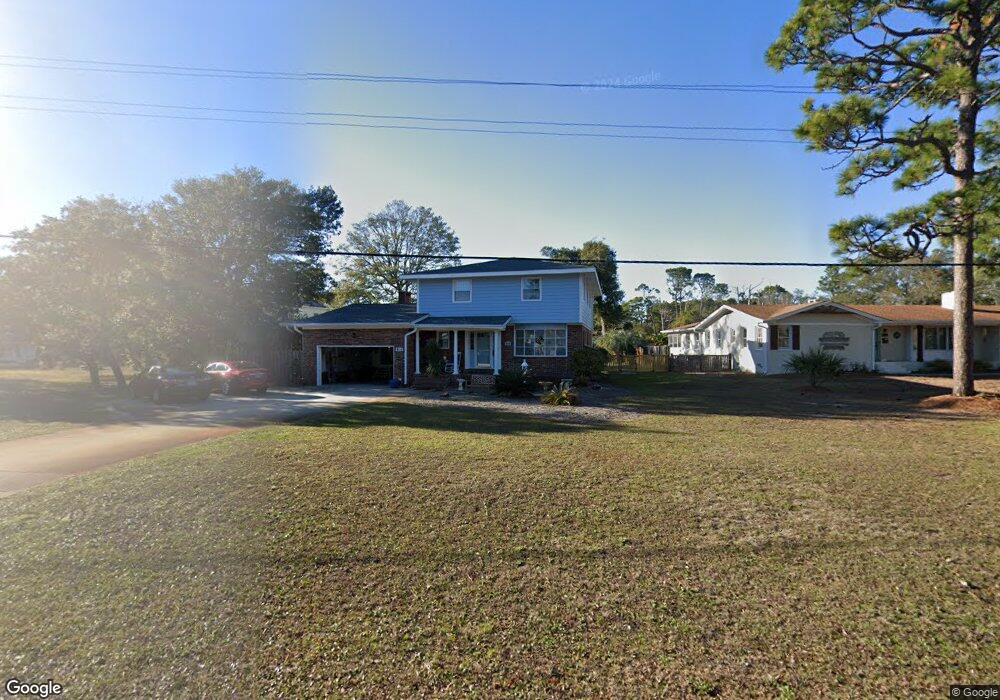
815 E Moore St Southport, NC 28461
Estimated Value: $671,419 - $847,000
5
Beds
3
Baths
2,577
Sq Ft
$286/Sq Ft
Est. Value
About This Home
This home is located at 815 E Moore St, Southport, NC 28461 and is currently estimated at $735,855, approximately $285 per square foot. 815 E Moore St is a home located in Brunswick County with nearby schools including Southport Elementary School, South Brunswick Middle School, and South Brunswick High School.
Ownership History
Date
Name
Owned For
Owner Type
Purchase Details
Closed on
Feb 10, 2017
Sold by
Hardy Tony S
Bought by
Bruton Pamela B
Current Estimated Value
Purchase Details
Closed on
Jul 30, 2008
Sold by
Bruton Pamela B
Bought by
Bruton Pamela B and Hardy Tony S
Home Financials for this Owner
Home Financials are based on the most recent Mortgage that was taken out on this home.
Original Mortgage
$396,775
Interest Rate
5.75%
Mortgage Type
New Conventional
Create a Home Valuation Report for This Property
The Home Valuation Report is an in-depth analysis detailing your home's value as well as a comparison with similar homes in the area
Home Values in the Area
Average Home Value in this Area
Purchase History
| Date | Buyer | Sale Price | Title Company |
|---|---|---|---|
| Bruton Pamela B | -- | None Available | |
| Bruton Pamela B | -- | None Available |
Source: Public Records
Mortgage History
| Date | Status | Borrower | Loan Amount |
|---|---|---|---|
| Previous Owner | Bruton Pamela B | $396,775 |
Source: Public Records
Tax History Compared to Growth
Tax History
| Year | Tax Paid | Tax Assessment Tax Assessment Total Assessment is a certain percentage of the fair market value that is determined by local assessors to be the total taxable value of land and additions on the property. | Land | Improvement |
|---|---|---|---|---|
| 2025 | $2,180 | $514,570 | $146,400 | $368,170 |
| 2024 | $2,180 | $514,570 | $146,400 | $368,170 |
| 2023 | $3,648 | $514,570 | $146,400 | $368,170 |
| 2022 | $3,648 | $352,850 | $90,000 | $262,850 |
| 2021 | $3,170 | $352,850 | $90,000 | $262,850 |
| 2020 | $3,170 | $352,850 | $90,000 | $262,850 |
| 2019 | $3,170 | $104,830 | $90,000 | $14,830 |
| 2018 | $3,050 | $139,550 | $120,000 | $19,550 |
| 2017 | $3,025 | $139,550 | $120,000 | $19,550 |
| 2016 | $2,806 | $139,550 | $120,000 | $19,550 |
| 2015 | $2,806 | $338,190 | $120,000 | $218,190 |
| 2014 | $2,785 | $355,078 | $130,000 | $225,078 |
Source: Public Records
Map
Nearby Homes
- 717 E Moore St
- 103 Herring Dr
- 1012 E Moore St
- 712 Longleaf Dr
- 1015 E Moore St
- 702 E Moore St Unit 207
- 282 Sand Dollar Ln
- 282 Sand Dollar Ln Unit 38
- 1003 Softwind Way
- 306 N Fodale Ave
- 1010 Softwind Way
- 1014 Softwind Way
- 511 E Moore St
- 204 Joshuas Way
- 207 Rosco
- 2071 Rosin Dr Unit 19
- 2079 Rosin Dr
- 2079 Rosin Dr Unit 17
- 2028 Oakton Dr
- 2035 Oakton Dr Unit 9
- 819 E Moore St
- 108 Frink Dr
- 110 Frink Dr
- 105 N Fodale Ave
- 808 E Moore St
- 806 E Moore St
- 112 Frink Dr
- 102 S Fodale Ave
- 721 E Moore St
- 804 E Moore St
- 107 Frink Dr
- 902 E Moore St
- 109 Frink Dr
- 101 River Dr
- Lot 97 Corner E Nash & Fodale
- 114 Frink Dr
- 719 E Moore St
- 103 River Dr
- 904 E Moore St
- 105 River Dr