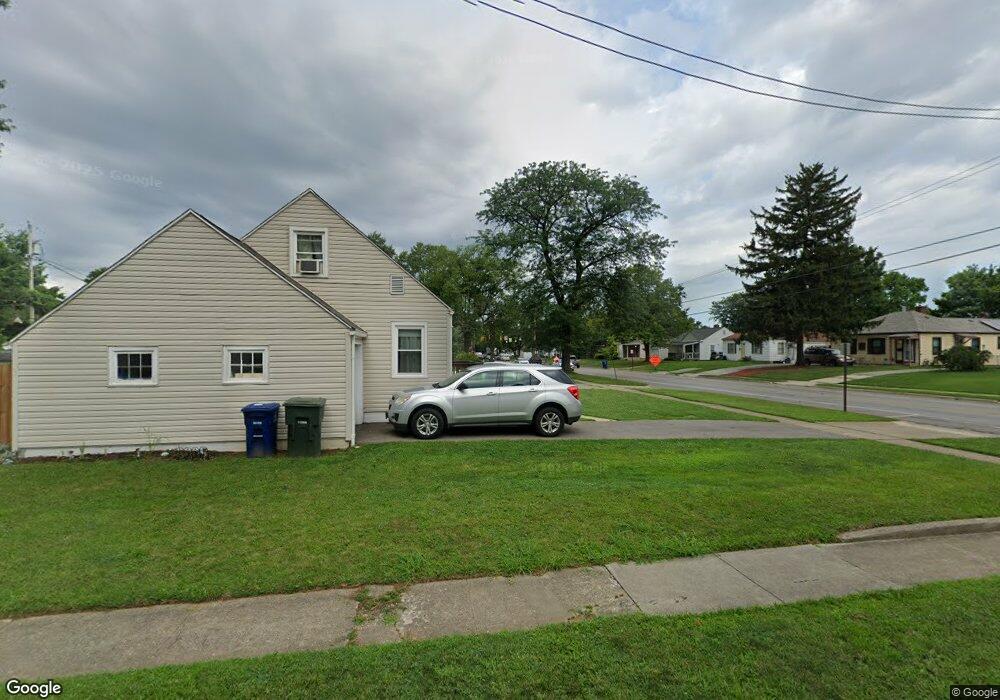
815 E Weber Rd Columbus, OH 43211
North Linden NeighborhoodEstimated Value: $152,000 - $201,000
3
Beds
1
Bath
1,500
Sq Ft
$122/Sq Ft
Est. Value
About This Home
This home is located at 815 E Weber Rd, Columbus, OH 43211 and is currently estimated at $183,680, approximately $122 per square foot. 815 E Weber Rd is a home located in Franklin County with nearby schools including Como Elementary School, Dominion Middle School, and Whetstone High School.
Ownership History
Date
Name
Owned For
Owner Type
Purchase Details
Closed on
Apr 25, 2023
Sold by
Mobley-Clemons Anita M
Bought by
Clemons Andre and Mobley-Clemons Anita M
Current Estimated Value
Purchase Details
Closed on
Apr 14, 2023
Sold by
Mobley-Clemons Anita M
Bought by
Clemons Andre and Mobley-Clemons Anita M
Purchase Details
Closed on
Apr 29, 2010
Sold by
Ohio Development Fund Llc
Bought by
Mobley Anita
Home Financials for this Owner
Home Financials are based on the most recent Mortgage that was taken out on this home.
Original Mortgage
$73,641
Interest Rate
5.5%
Mortgage Type
FHA
Purchase Details
Closed on
Sep 29, 2008
Sold by
Fannie Mae
Bought by
The Ohio Development Fund Ltd
Purchase Details
Closed on
Aug 27, 2008
Sold by
Brady Long Mary A
Bought by
Federal National Mortgage Association
Purchase Details
Closed on
Apr 3, 1990
Bought by
Brady Timothy and Brady Mary A
Create a Home Valuation Report for This Property
The Home Valuation Report is an in-depth analysis detailing your home's value as well as a comparison with similar homes in the area
Home Values in the Area
Average Home Value in this Area
Purchase History
| Date | Buyer | Sale Price | Title Company |
|---|---|---|---|
| Clemons Andre | -- | None Listed On Document | |
| Clemons Andre | -- | None Listed On Document | |
| Mobley Anita | $75,000 | None Available | |
| The Ohio Development Fund Ltd | $29,000 | Title First | |
| Federal National Mortgage Association | $44,000 | None Available | |
| Brady Timothy | $47,000 | -- |
Source: Public Records
Mortgage History
| Date | Status | Borrower | Loan Amount |
|---|---|---|---|
| Previous Owner | Mobley Anita | $73,641 |
Source: Public Records
Tax History
| Year | Tax Paid | Tax Assessment Tax Assessment Total Assessment is a certain percentage of the fair market value that is determined by local assessors to be the total taxable value of land and additions on the property. | Land | Improvement |
|---|---|---|---|---|
| 2025 | $2,410 | $53,700 | $11,100 | $42,600 |
| 2024 | $2,410 | $53,700 | $11,100 | $42,600 |
| 2023 | $2,379 | $53,700 | $11,100 | $42,600 |
| 2022 | $1,609 | $31,020 | $8,160 | $22,860 |
| 2021 | $1,612 | $31,020 | $8,160 | $22,860 |
| 2020 | $1,614 | $31,020 | $8,160 | $22,860 |
| 2019 | $1,603 | $26,430 | $7,110 | $19,320 |
| 2018 | $1,441 | $26,430 | $7,110 | $19,320 |
| 2017 | $1,507 | $26,430 | $7,110 | $19,320 |
| 2016 | $1,412 | $21,320 | $3,780 | $17,540 |
| 2015 | $1,282 | $21,320 | $3,780 | $17,540 |
| 2014 | $1,285 | $21,320 | $3,780 | $17,540 |
| 2013 | $745 | $25,060 | $4,445 | $20,615 |
Source: Public Records
Map
Nearby Homes
- 773 Melrose Ave
- 816 Melrose Ave
- 3035 Audubon Rd
- 2805 Beulah Rd
- 964 E Weber Rd
- 2733 Beulah Rd
- 580 Crestview Rd
- 555 E Weber Rd
- 2872 Howey Rd
- 2888 Howey Rd
- 521 Melrose Ave
- 2593 Osceola Ave
- 2897 Grasmere Ave
- 2992 Howey Rd
- 2874 Grasmere Ave
- 2569 Audubon Rd
- 978 E North Broadway St
- 2560 Osceola Ave
- 2950 Grasmere Ave
- 2593 Atwood Terrace
- 807 E Weber Rd
- 801 E Weber Rd
- 808 E Tibet Rd
- 833 E Weber Rd
- 800 E Tibet Rd
- 2880 Audubon Rd
- 2872 Audubon Rd
- 795 E Weber Rd
- 2866 Audubon Rd
- 794 E Tibet Rd
- 818 E Weber Rd
- 812 E Weber Rd
- 2858 Audubon Rd
- 824 E Weber Rd
- 788 E Tibet Rd
- 806 E Weber Rd
- 787 E Weber Rd
- 830 E Weber Rd
- 841 E Weber Rd Unit 843
- 800 E Weber Rd
Your Personal Tour Guide
Ask me questions while you tour the home.