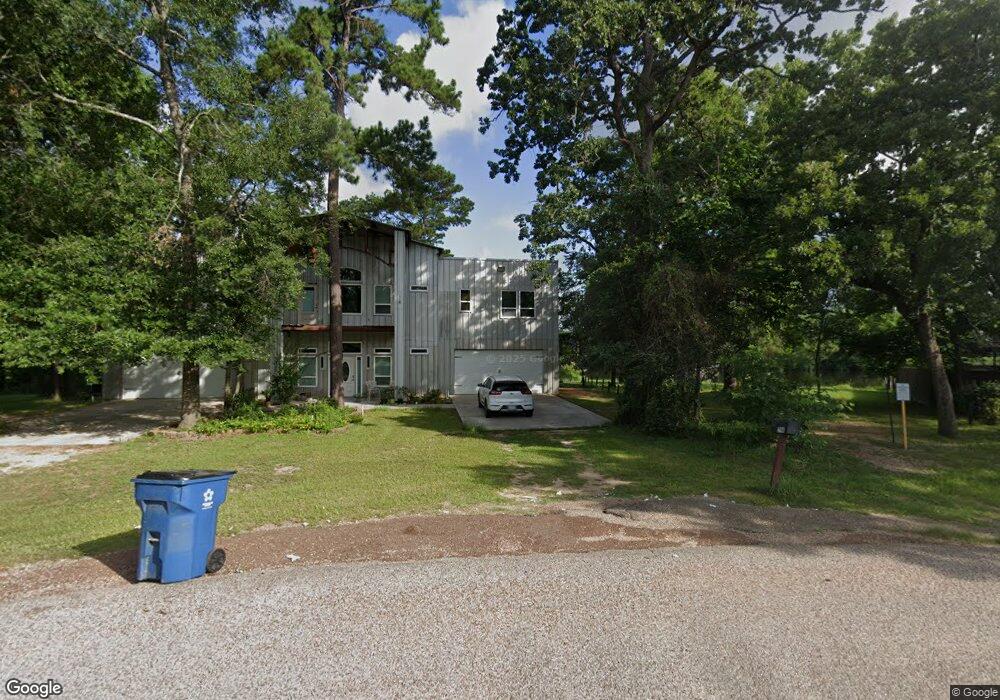
815 Glen Hollow Dr Conroe, TX 77385
College Park NeighborhoodEstimated Value: $351,000 - $455,570
--
Bed
--
Bath
3,318
Sq Ft
$120/Sq Ft
Est. Value
About This Home
This home is located at 815 Glen Hollow Dr, Conroe, TX 77385 and is currently estimated at $397,893, approximately $119 per square foot. 815 Glen Hollow Dr is a home located in Montgomery County with nearby schools including Wilkinson Elementary School, Stockton Junior High School, and Bozman Intermediate School.
Ownership History
Date
Name
Owned For
Owner Type
Purchase Details
Closed on
Jun 14, 2013
Sold by
Matos David and Matos Elizabeth
Bought by
Ecklund Mark and Ecklund Sylvia
Current Estimated Value
Purchase Details
Closed on
Feb 1, 2013
Sold by
Langenhoven Lance
Bought by
Matos David A
Purchase Details
Closed on
Sep 22, 2008
Sold by
Gillard John and Gillard Callie
Bought by
Matos David and Matos Carmen
Purchase Details
Closed on
Oct 12, 2007
Sold by
Pine Brook Homes Lp
Bought by
Gillard John and Gillard Callie
Home Financials for this Owner
Home Financials are based on the most recent Mortgage that was taken out on this home.
Original Mortgage
$23,275
Interest Rate
6.37%
Mortgage Type
Purchase Money Mortgage
Purchase Details
Closed on
Oct 5, 2004
Sold by
Simon Jay W and Robin Kairis Gail
Bought by
Pinebrook Homes Lp
Create a Home Valuation Report for This Property
The Home Valuation Report is an in-depth analysis detailing your home's value as well as a comparison with similar homes in the area
Home Values in the Area
Average Home Value in this Area
Purchase History
| Date | Buyer | Sale Price | Title Company |
|---|---|---|---|
| Ecklund Mark | -- | First American Title | |
| Matos David A | -- | First American Title | |
| Matos David | -- | Vanguard Title | |
| Gillard John | -- | Texas American Title Company | |
| Pinebrook Homes Lp | $6,352 | -- |
Source: Public Records
Mortgage History
| Date | Status | Borrower | Loan Amount |
|---|---|---|---|
| Previous Owner | Gillard John | $23,275 |
Source: Public Records
Tax History Compared to Growth
Tax History
| Year | Tax Paid | Tax Assessment Tax Assessment Total Assessment is a certain percentage of the fair market value that is determined by local assessors to be the total taxable value of land and additions on the property. | Land | Improvement |
|---|---|---|---|---|
| 2025 | $885 | $154,000 | -- | -- |
| 2024 | $2,414 | $154,000 | -- | -- |
| 2023 | $2,414 | $152,010 | $30,160 | $121,850 |
| 2022 | $2,720 | $144,400 | $30,160 | $114,240 |
| 2021 | $2,462 | $106,830 | $30,160 | $76,670 |
| 2020 | $2,607 | $108,140 | $30,160 | $77,980 |
| 2019 | $2,136 | $85,300 | $30,160 | $55,140 |
| 2018 | $2,028 | $81,000 | $30,160 | $50,840 |
| 2017 | $5,949 | $240,360 | $30,160 | $210,200 |
| 2016 | $4,487 | $181,280 | $6,920 | $174,360 |
| 2015 | $179 | $6,920 | $6,920 | $0 |
| 2014 | $179 | $6,920 | $6,920 | $0 |
Source: Public Records
Map
Nearby Homes
- 813 Glen Hollow Ct
- 711 Glen Haven Dr
- TBD Brook Hollow Dr
- 413 Brook Hollow Dr
- 401 Glen Haven Dr
- 410 Brook Hollow Dr
- 303 Shady Glen Ln
- 10 Orchid Grove Place
- 155 W Drifting Shadows Cir
- 208 Sherbrook Cir
- 206 Sherbrook Cir
- 0 W Essex Dr
- 46 S April Mist Cir
- 9921 Kingfisher Dr
- 0 Harris Rd
- 10211 Essex
- 10 Clarewood Ct
- 74 Wimberly Way
- 9838 Bobolink Dr
- TBD S Essex Dr
- 905 Brook Forest Dr
- 907 Brook Forest Dr
- 801 Glen Hollow Dr
- 802 Glen Hollow Dr
- 906 Brook Forest Dr
- 906 Brook Forest Dr
- 625 Brook Hollow Dr
- 629 Brook Hollow Dr
- 803 Glen Hollow Dr
- 906 Brook Forest Ct
- 701 Brook Hollow Dr
- 911 Brook Forest Dr
- 623 Brook Hollow Dr
- 805 Glen Hollow Dr
- 908 Brook Forest Ct
- 621 Brook Hollow Dr
- 912 Brook Forest Ct
- 912 Brook Forest Ct
- 707 Brook Hollow Dr
- 910 Brook Forest Ct