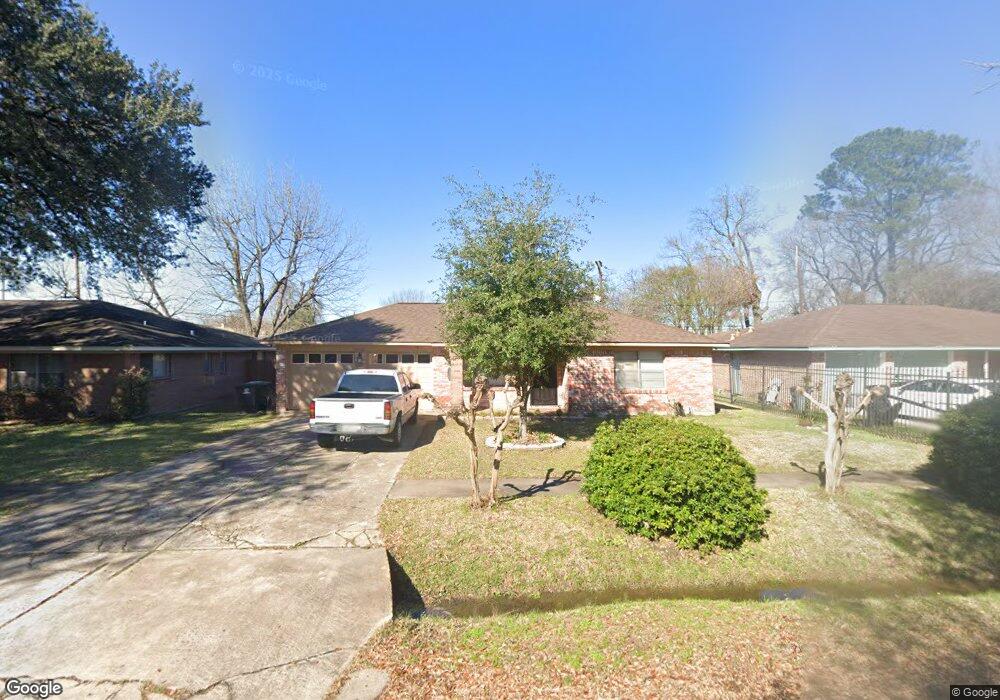
815 Hurley St Houston, TX 77022
Northside-Northline NeighborhoodEstimated Value: $232,664 - $271,000
3
Beds
2
Baths
1,393
Sq Ft
$186/Sq Ft
Est. Value
About This Home
This home is located at 815 Hurley St, Houston, TX 77022 and is currently estimated at $258,916, approximately $185 per square foot. 815 Hurley St is a home located in Harris County with nearby schools including Burbank Elementary School, Burbank Middle School, and Sam Houston Math, Science & Technology Center.
Ownership History
Date
Name
Owned For
Owner Type
Purchase Details
Closed on
Aug 2, 2004
Sold by
Lee Benson and Lee Sau N
Bought by
Casas Raul
Current Estimated Value
Home Financials for this Owner
Home Financials are based on the most recent Mortgage that was taken out on this home.
Original Mortgage
$99,000
Outstanding Balance
$49,938
Interest Rate
6.26%
Mortgage Type
Purchase Money Mortgage
Estimated Equity
$208,978
Create a Home Valuation Report for This Property
The Home Valuation Report is an in-depth analysis detailing your home's value as well as a comparison with similar homes in the area
Home Values in the Area
Average Home Value in this Area
Purchase History
| Date | Buyer | Sale Price | Title Company |
|---|---|---|---|
| Casas Raul | -- | Fidelity National Title |
Source: Public Records
Mortgage History
| Date | Status | Borrower | Loan Amount |
|---|---|---|---|
| Open | Casas Raul | $99,000 |
Source: Public Records
Tax History Compared to Growth
Tax History
| Year | Tax Paid | Tax Assessment Tax Assessment Total Assessment is a certain percentage of the fair market value that is determined by local assessors to be the total taxable value of land and additions on the property. | Land | Improvement |
|---|---|---|---|---|
| 2025 | $38 | $217,907 | $95,684 | $122,223 |
| 2024 | $38 | $210,788 | $87,815 | $122,973 |
| 2023 | $38 | $247,144 | $53,508 | $193,636 |
| 2022 | $3,815 | $207,618 | $53,508 | $154,110 |
| 2021 | $3,671 | $165,024 | $53,508 | $111,516 |
| 2020 | $3,467 | $152,469 | $53,508 | $98,961 |
| 2019 | $3,294 | $149,019 | $44,065 | $104,954 |
| 2018 | $461 | $120,034 | $36,826 | $83,208 |
| 2017 | $2,720 | $120,034 | $36,826 | $83,208 |
| 2016 | $2,473 | $111,919 | $34,623 | $77,296 |
| 2015 | $1,658 | $88,904 | $25,180 | $63,724 |
| 2014 | $1,658 | $88,904 | $25,180 | $63,724 |
Source: Public Records
Map
Nearby Homes
- 702 Pennington St
- 807 Firnat St
- 1207 Firnat St
- 9026 Mcgallion Rd
- 723 Doverside St
- 318 Charlock St
- 415 Briarcliff Dr
- 9650 E Hardy Rd
- 253 De Boll St
- 249 De Boll St
- 88 Berry Rd
- 1104 Charnwood St
- 8411 Berry Brush Ln
- 411 Berry Rd
- 8402 Berry Green Ln
- 216 Burress St
- 802 Berry Sage Ln
- 202 Burbank St
- 219 Heaney Dr
- 8205 Appleton St
- 811 Hurley St
- 819 Hurley St
- 807 Hurley St
- 823 Hurley St
- 908 Tidwell Rd
- 818 Hurley St
- 810 Hurley St
- 803 Hurley St
- 9214 Goldcrest St
- 806 Hurley St
- 9210 Goldcrest St
- 723 Hurley St
- 815 Pennington St
- 802 Hurley St
- 819 Pennington St
- 811 Pennington St
- 9206 Goldcrest St
- 807 Pennington St
- 722 Hurley St
- 924 Tidwell Rd