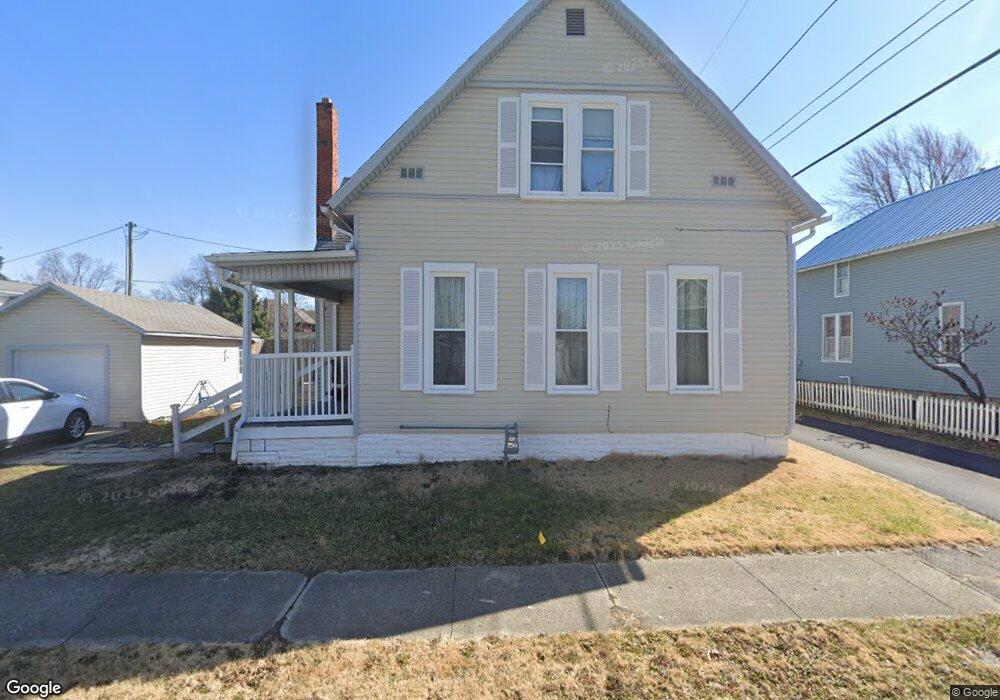
815 Maple Ave Findlay, OH 45840
Estimated Value: $145,000 - $183,000
3
Beds
1
Bath
1,496
Sq Ft
$113/Sq Ft
Est. Value
About This Home
This home is located at 815 Maple Ave, Findlay, OH 45840 and is currently estimated at $168,556, approximately $112 per square foot. 815 Maple Ave is a home located in Hancock County with nearby schools including Lincoln Elementary School, Donnell Middle School, and Findlay High School.
Ownership History
Date
Name
Owned For
Owner Type
Purchase Details
Closed on
Jul 20, 2020
Sold by
Mcfadden Todd D
Bought by
Mcfadden Rentals I Llc
Current Estimated Value
Home Financials for this Owner
Home Financials are based on the most recent Mortgage that was taken out on this home.
Original Mortgage
$63,750
Outstanding Balance
$56,634
Interest Rate
3.2%
Mortgage Type
New Conventional
Estimated Equity
$111,922
Purchase Details
Closed on
Sep 18, 2015
Bought by
Yellow Bird Rentals Llc
Home Financials for this Owner
Home Financials are based on the most recent Mortgage that was taken out on this home.
Interest Rate
3.91%
Purchase Details
Closed on
Jan 6, 2010
Sold by
Fannie Mae
Bought by
Montgomery Tamara L
Purchase Details
Closed on
Dec 17, 2009
Sold by
Cramer Janet Mary
Bought by
Federal National Mortgage Association
Create a Home Valuation Report for This Property
The Home Valuation Report is an in-depth analysis detailing your home's value as well as a comparison with similar homes in the area
Home Values in the Area
Average Home Value in this Area
Purchase History
| Date | Buyer | Sale Price | Title Company |
|---|---|---|---|
| Mcfadden Rentals I Llc | -- | Assured Title Agency | |
| Mcfadden Todd D | $85,000 | Assured Title Agency | |
| Yellow Bird Rentals Llc | -- | -- | |
| Montgomery Tamara L | $30,000 | Attorney | |
| Federal National Mortgage Association | $29,000 | Attorney |
Source: Public Records
Mortgage History
| Date | Status | Borrower | Loan Amount |
|---|---|---|---|
| Open | Mcfadden Todd D | $63,750 | |
| Previous Owner | Yellow Bird Rentals Llc | -- |
Source: Public Records
Tax History
| Year | Tax Paid | Tax Assessment Tax Assessment Total Assessment is a certain percentage of the fair market value that is determined by local assessors to be the total taxable value of land and additions on the property. | Land | Improvement |
|---|---|---|---|---|
| 2024 | $1,776 | $48,720 | $3,990 | $44,730 |
| 2023 | $1,779 | $48,720 | $3,990 | $44,730 |
| 2022 | $1,773 | $48,720 | $3,990 | $44,730 |
| 2021 | $1,519 | $36,370 | $3,980 | $32,390 |
| 2020 | $1,519 | $36,370 | $3,980 | $32,390 |
| 2019 | $1,489 | $36,370 | $3,980 | $32,390 |
| 2018 | $1,306 | $29,220 | $3,190 | $26,030 |
| 2017 | $652 | $29,220 | $3,190 | $26,030 |
| 2016 | $1,295 | $29,220 | $3,190 | $26,030 |
| 2015 | $1,145 | $25,460 | $2,730 | $22,730 |
| 2014 | $1,145 | $25,460 | $2,730 | $22,730 |
| 2012 | $1,156 | $25,460 | $2,730 | $22,730 |
Source: Public Records
Map
Nearby Homes
- 829 Maple Ave
- 865 S Main St
- 216 1st St
- 815 Liberty St
- 1120 S West St
- 123 Glendale Ave
- 412 Lima Ave
- 845 Hurd Ave
- 206 Greenlawn Ave
- 423 Elm St
- 860 Hurd Ave
- 514 Liberty St
- 623 E Sandusky St
- 1113 Hurd Ave
- 527 W Sandusky St
- 324 W Mcpherson Ave
- 731 5th St
- 15591 Canadian Way
- 15586 Canadian Way
- 15615 Canadian Way
- 807 Maple Ave Unit 807 Maple Ave (U3), Findlay Ohio, 45840
- 305 E Lima St
- 301 E Lima St
- 812 Maple Ave
- 819 Maple Ave
- 309 E Lima St
- 219 E Lima St
- 309 E Lima St
- 823 Maple Ave
- 818 Maple Ave
- 313 E Lima St
- 211 E Lima St
- 822 Maple Ave
- 828 Maple Ave
- 209 E Lima St
- 833 Maple Ave
- 317 E Lima St
- 832 Maple Ave
- 205 E Lima St
- 232 E Lima St
Your Personal Tour Guide
Ask me questions while you tour the home.