Estimated Value: $97,000 - $134,362
3
Beds
2
Baths
1,320
Sq Ft
$89/Sq Ft
Est. Value
About This Home
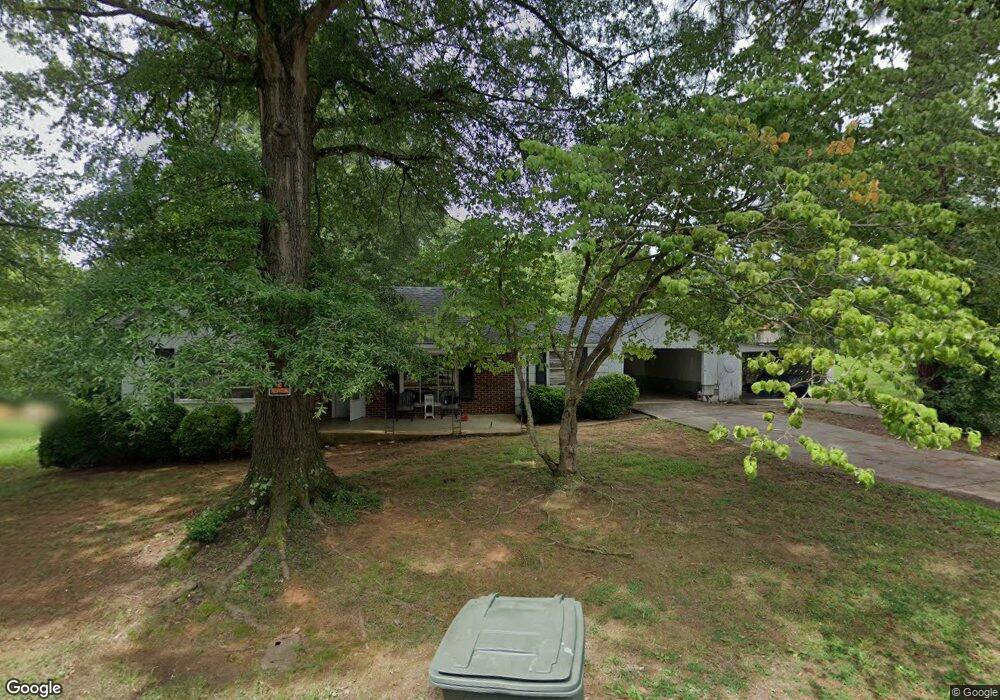
This home is located at 815 Martin St, Eden, NC 27288 and is currently estimated at $116,841, approximately $88 per square foot. 815 Martin St is a home located in Rockingham County with nearby schools including Leaksville-Spray Elementary School, J.E. Holmes Middle School, and John M. Morehead High School.
Ownership History
Date
Name
Owned For
Owner Type
Purchase Details
Closed on
Jan 6, 2010
Sold by
Federal National Mortgage Association
Bought by
Hairston Demarius J
Current Estimated Value
Purchase Details
Closed on
Sep 16, 2009
Sold by
Bananto Meghan Mari
Bought by
Federal National Mortgage Association
Purchase Details
Closed on
Aug 9, 2007
Sold by
Stanfield Colter Bradley and Stanfield Brad
Bought by
Bananto Meghan Mari
Home Financials for this Owner
Home Financials are based on the most recent Mortgage that was taken out on this home.
Original Mortgage
$58,000
Interest Rate
6.65%
Mortgage Type
New Conventional
Purchase Details
Closed on
Dec 21, 2006
Sold by
Federal Home Loan Mortgage Corporation
Bought by
Stanfield Brad
Purchase Details
Closed on
Sep 19, 2006
Sold by
Gerringer Gerald D and Abn Amro Mortgage Group Inc
Bought by
Federal Home Loan Mortgage Corporation
Create a Home Valuation Report for This Property
The Home Valuation Report is an in-depth analysis detailing your home's value as well as a comparison with similar homes in the area
Home Values in the Area
Average Home Value in this Area
Purchase History
| Date | Buyer | Sale Price | Title Company |
|---|---|---|---|
| Hairston Demarius J | -- | None Available | |
| Federal National Mortgage Association | -- | None Available | |
| Bananto Meghan Mari | $58,000 | None Available | |
| Stanfield Brad | -- | None Available | |
| Federal Home Loan Mortgage Corporation | $51,418 | None Available |
Source: Public Records
Mortgage History
| Date | Status | Borrower | Loan Amount |
|---|---|---|---|
| Previous Owner | Bananto Meghan Mari | $58,000 |
Source: Public Records
Tax History Compared to Growth
Tax History
| Year | Tax Paid | Tax Assessment Tax Assessment Total Assessment is a certain percentage of the fair market value that is determined by local assessors to be the total taxable value of land and additions on the property. | Land | Improvement |
|---|---|---|---|---|
| 2025 | $794 | $72,185 | $5,544 | $66,641 |
| 2024 | $794 | $72,185 | $5,544 | $66,641 |
| 2023 | $707 | $54,251 | $6,300 | $47,951 |
| 2022 | $707 | $54,251 | $6,300 | $47,951 |
| 2021 | $707 | $54,251 | $6,300 | $47,951 |
| 2020 | $707 | $54,251 | $6,300 | $47,951 |
| 2019 | $707 | $54,251 | $6,300 | $47,951 |
| 2018 | $593 | $45,474 | $9,300 | $36,174 |
| 2017 | $593 | $45,474 | $9,300 | $36,174 |
| 2015 | $599 | $45,474 | $9,300 | $36,174 |
| 2014 | $593 | $45,474 | $9,300 | $36,174 |
Source: Public Records
Map
Nearby Homes
- 925 Harris St
- 910 Branch St
- 615 S Hamilton St
- 989 Harris St
- 115 Mountain Laurel Trail
- 994 Burton St
- 627 Monroe St
- 543 Patrick St
- 535 Patrick St
- 521 Patrick St
- 627 Highland Dr
- 1015 West Ave
- 1028 Galloway St
- 561 N Bridge St
- 645 Patterson St
- 634 Highland Dr
- 526 N Bridge St
- 608 Cedar St
- 606 Cedar St
- 816 Elm St