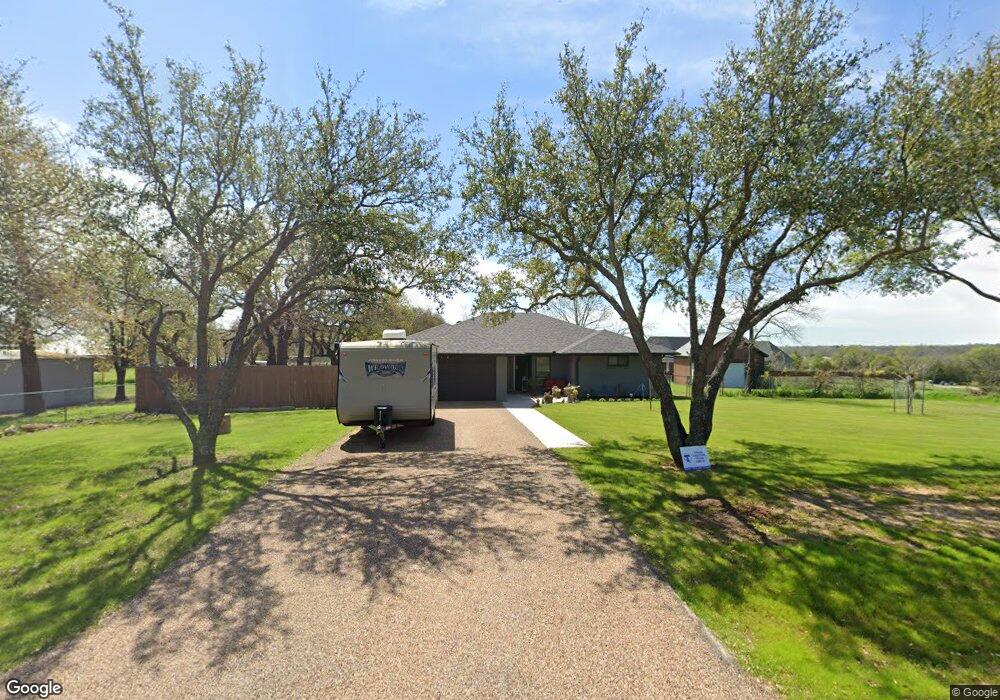
815 Murls Lake Dr Weatherford, TX 76085
Estimated Value: $372,000
--
Bed
--
Bath
1,596
Sq Ft
$233/Sq Ft
Est. Value
About This Home
This home is located at 815 Murls Lake Dr, Weatherford, TX 76085 and is currently estimated at $372,000, approximately $233 per square foot. 815 Murls Lake Dr is a home located in Parker County with nearby schools including Martin Elementary School, Tison Middle School, and Weatherford High School.
Ownership History
Date
Name
Owned For
Owner Type
Purchase Details
Closed on
Aug 21, 2019
Sold by
Fortenberry Edwin Grimes
Bought by
Mcclelland Laura and Klutts Lynann
Current Estimated Value
Home Financials for this Owner
Home Financials are based on the most recent Mortgage that was taken out on this home.
Original Mortgage
$148,000
Interest Rate
3.8%
Mortgage Type
Seller Take Back
Purchase Details
Closed on
Mar 7, 2014
Sold by
Betts Bobby James and Betts John Waymon
Bought by
Betts Fortenberry Rachel Louise
Purchase Details
Closed on
Feb 28, 2014
Sold by
Betts Ruby M
Bought by
Fortenberry Rachel Louise Betts
Purchase Details
Closed on
May 29, 2013
Sold by
Betts James W
Bought by
Fortenberry Rachel Louise Betts
Purchase Details
Closed on
Dec 3, 1987
Sold by
Federal Deposit Insurance Corp
Bought by
Fortenberry Rachel Louise Betts
Create a Home Valuation Report for This Property
The Home Valuation Report is an in-depth analysis detailing your home's value as well as a comparison with similar homes in the area
Home Values in the Area
Average Home Value in this Area
Purchase History
| Date | Buyer | Sale Price | Title Company |
|---|---|---|---|
| Mcclelland Laura | -- | Fidelity National Title Azle | |
| Betts Fortenberry Rachel Louise | -- | None Available | |
| Fortenberry Rachel Louise Betts | -- | -- | |
| Fortenberry Rachel Louise Betts | -- | -- | |
| Fortenberry Rachel Louise Betts | -- | -- |
Source: Public Records
Mortgage History
| Date | Status | Borrower | Loan Amount |
|---|---|---|---|
| Closed | Mcclelland Laura | $148,000 |
Source: Public Records
Tax History Compared to Growth
Tax History
| Year | Tax Paid | Tax Assessment Tax Assessment Total Assessment is a certain percentage of the fair market value that is determined by local assessors to be the total taxable value of land and additions on the property. | Land | Improvement |
|---|---|---|---|---|
| 2025 | $2,912 | $266,563 | -- | -- |
| 2024 | $2,912 | $242,330 | -- | -- |
| 2023 | $2,912 | $220,300 | $0 | $0 |
| 2022 | $3,729 | $200,280 | $83,650 | $116,630 |
| 2021 | $4,043 | $200,280 | $83,650 | $116,630 |
| 2020 | $3,987 | $196,590 | $63,860 | $132,730 |
| 2019 | $3,391 | $196,590 | $63,860 | $132,730 |
| 2018 | $3,099 | $142,470 | $35,730 | $106,740 |
| 2017 | $2,886 | $142,470 | $35,730 | $106,740 |
| 2016 | $2,623 | $118,180 | $35,730 | $82,450 |
| 2015 | $1,240 | $118,180 | $35,730 | $82,450 |
| 2014 | $1,927 | $95,190 | $16,490 | $78,700 |
Source: Public Records
Map
Nearby Homes
- 719 Gail Dr
- 707 Gail Dr
- 2113-A Dicey Rd
- 313 De la Cruz St
- 309 De la Cruz St
- Big Cypress II Plan at Waterford Park
- San Gabriel II Plan at Waterford Park
- Cascade II Plan at Waterford Park
- Lavon Plan at Waterford Park
- Nueces Plan at Waterford Park
- Verbena V2 Plan at Waterford Park
- San Saba III Plan at Waterford Park
- Bluebonnet Plan at Waterford Park
- Havasu III Plan at Waterford Park
- Navasota Plan at Waterford Park
- Neches Plan at Waterford Park
- 557 Waterford Park Blvd
- 549 Waterford Park Blvd
- 541 Waterford Park Blvd
- 544 Waterford Park Blvd
- 809 Murls Lake Dr
- 109 Murls Lake Cir
- 472 Valley Ln
- 106 Murls Lake Cir
- 807 Murls Lake Dr
- 905 Murls Lake Dr
- 117 Murls Lake Cir
- 110 Murls Lake Cir
- 805 Murls Lake Dr
- 112 Murls Lake Cir
- 494 Valley Ln
- 803 Murls Lake Dr
- 460 Valley Ln
- 919 Lake Dr
- 801 Murls Lake Dr
- 450 Valley Ln
- 440 Valley Ln
- 420 Valley Ln Unit 430
- 961 Lake Dr
- 811 Lake Dr