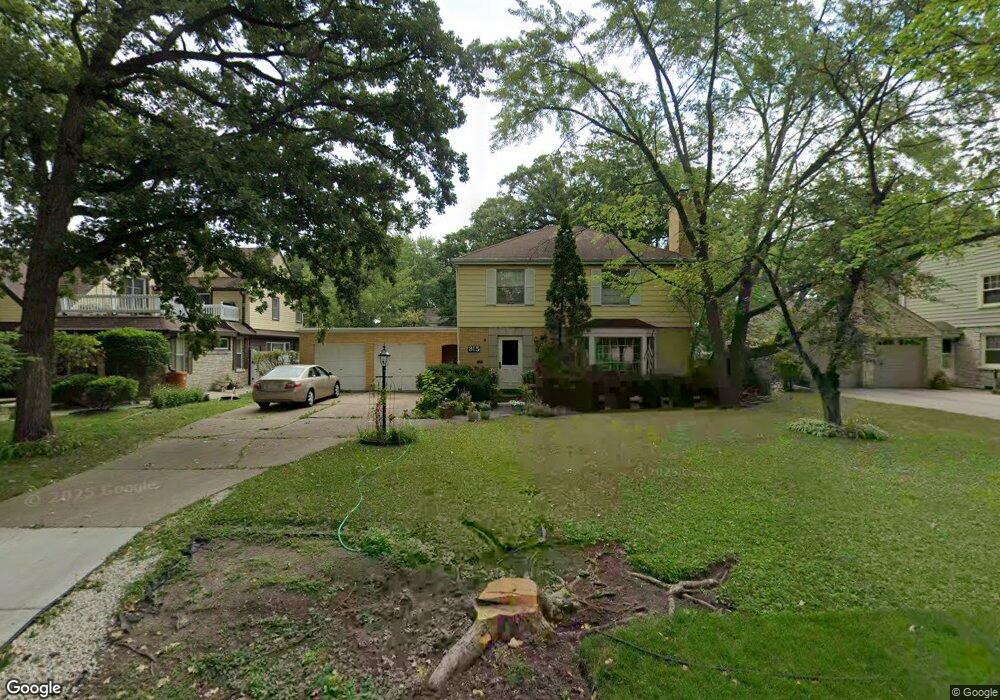
815 N Spring Ave La Grange Park, IL 60526
Estimated Value: $592,000 - $710,000
4
Beds
2
Baths
1,518
Sq Ft
$415/Sq Ft
Est. Value
About This Home
This home is located at 815 N Spring Ave, La Grange Park, IL 60526 and is currently estimated at $629,320, approximately $414 per square foot. 815 N Spring Ave is a home located in Cook County with nearby schools including Ogden Ave Elementary School, Park Junior High School, and Lyons Township High School.
Ownership History
Date
Name
Owned For
Owner Type
Purchase Details
Closed on
Jan 26, 1993
Sold by
Fried Nancy J and Hull Sharon K
Bought by
Glenview State Bank
Current Estimated Value
Create a Home Valuation Report for This Property
The Home Valuation Report is an in-depth analysis detailing your home's value as well as a comparison with similar homes in the area
Home Values in the Area
Average Home Value in this Area
Purchase History
| Date | Buyer | Sale Price | Title Company |
|---|---|---|---|
| Glenview State Bank | -- | -- |
Source: Public Records
Tax History Compared to Growth
Tax History
| Year | Tax Paid | Tax Assessment Tax Assessment Total Assessment is a certain percentage of the fair market value that is determined by local assessors to be the total taxable value of land and additions on the property. | Land | Improvement |
|---|---|---|---|---|
| 2024 | $11,245 | $50,001 | $10,973 | $39,028 |
| 2023 | $10,006 | $50,001 | $10,973 | $39,028 |
| 2022 | $10,006 | $39,043 | $8,728 | $30,315 |
| 2021 | $9,665 | $39,042 | $8,728 | $30,314 |
| 2020 | $9,555 | $39,042 | $8,728 | $30,314 |
| 2019 | $8,132 | $34,727 | $7,980 | $26,747 |
| 2018 | $9,723 | $34,727 | $7,980 | $26,747 |
| 2017 | $5,957 | $34,727 | $7,980 | $26,747 |
| 2016 | $8,074 | $31,003 | $7,231 | $23,772 |
| 2015 | $7,200 | $31,003 | $7,231 | $23,772 |
| 2014 | $7,114 | $31,003 | $7,231 | $23,772 |
| 2013 | $7,747 | $32,232 | $7,231 | $25,001 |
Source: Public Records
Map
Nearby Homes
- 836 N Waiola Ave
- 818 N La Grange Rd
- 725 N Catherine Ave
- 636 N Stone Ave
- 606 N Brainard Ave
- 638 N Edgewood Ave
- 734 Forest Rd
- 929 Sherwood Rd
- 314 E 31st St
- 527 Malden Ave
- 1132 Community Dr
- 415 N Ashland Ave
- 31 Richmond Ave
- 525 Homestead Rd
- 141 N La Grange Rd Unit 504
- 141 N La Grange Rd Unit 905
- 54 N Ashland Ave
- 9532 Jackson Ave
- 9532 Lexington Ave
- 709 Bell Ave
- 819 N Spring Ave
- 807 N Spring Ave
- 814 N Kensington Ave
- 816 N Kensington Ave
- 825 N Spring Ave
- 810 N Kensington Ave
- 801 N Spring Ave
- 820 N Kensington Ave
- 804 N Kensington Ave
- 829 N Spring Ave
- 824 N Kensington Ave
- 814 N Spring Ave
- 810 N Spring Ave
- 802 N Kensington Ave
- 822 N Spring Ave
- 828 N Kensington Ave
- 833 N Spring Ave
- 830 N Spring Ave
- 802 N Spring Ave
- 832 N Kensington Ave