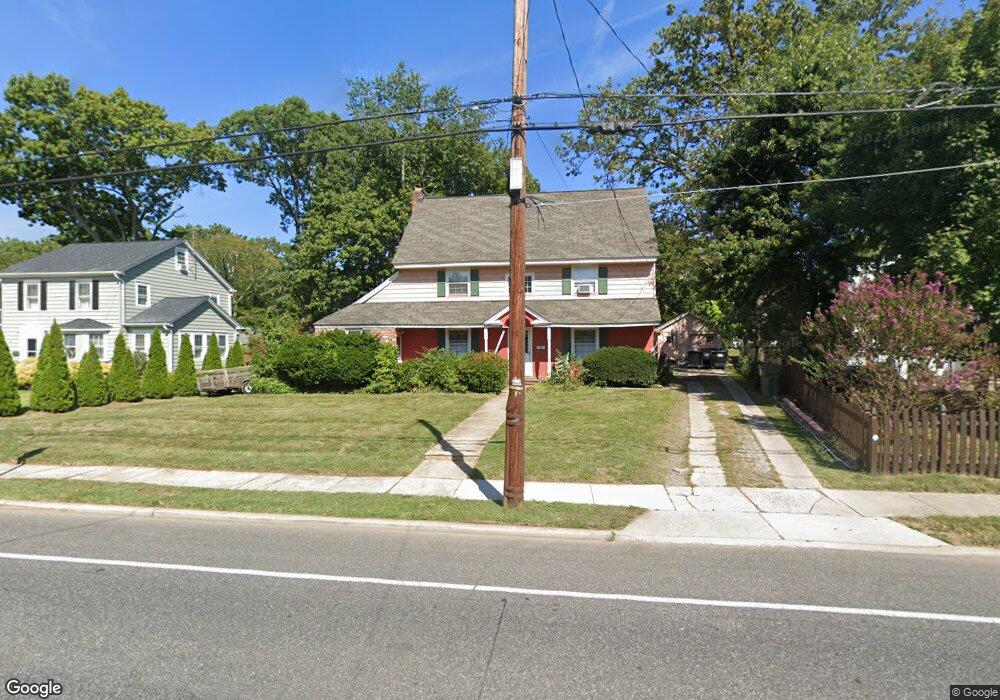
815 S Broadway Pitman, NJ 08071
Estimated Value: $421,000 - $460,000
6
Beds
3
Baths
2,927
Sq Ft
$149/Sq Ft
Est. Value
About This Home
This home is located at 815 S Broadway, Pitman, NJ 08071 and is currently estimated at $436,635, approximately $149 per square foot. 815 S Broadway is a home located in Gloucester County with nearby schools including Elwood Kindle School, Pitman Middle School, and Pitman High School.
Ownership History
Date
Name
Owned For
Owner Type
Purchase Details
Closed on
Oct 9, 2007
Sold by
Fitzpatrick John and Estate Of Rosemary Doebler
Bought by
Doebler Robert
Current Estimated Value
Purchase Details
Closed on
Sep 29, 1993
Sold by
Meduri Catherine
Bought by
Thorsen David and Thorsen Judy
Home Financials for this Owner
Home Financials are based on the most recent Mortgage that was taken out on this home.
Original Mortgage
$74,000
Interest Rate
6.73%
Mortgage Type
FHA
Create a Home Valuation Report for This Property
The Home Valuation Report is an in-depth analysis detailing your home's value as well as a comparison with similar homes in the area
Home Values in the Area
Average Home Value in this Area
Purchase History
| Date | Buyer | Sale Price | Title Company |
|---|---|---|---|
| Doebler Robert | $249,462 | Southern Counties Title Agen | |
| Thorsen David | $68,500 | -- |
Source: Public Records
Mortgage History
| Date | Status | Borrower | Loan Amount |
|---|---|---|---|
| Previous Owner | Thorsen David | $74,000 |
Source: Public Records
Tax History Compared to Growth
Tax History
| Year | Tax Paid | Tax Assessment Tax Assessment Total Assessment is a certain percentage of the fair market value that is determined by local assessors to be the total taxable value of land and additions on the property. | Land | Improvement |
|---|---|---|---|---|
| 2025 | $9,211 | $263,700 | $51,400 | $212,300 |
| 2024 | $8,968 | $263,700 | $51,400 | $212,300 |
| 2023 | $8,968 | $263,700 | $51,400 | $212,300 |
| 2022 | $8,615 | $263,700 | $51,400 | $212,300 |
| 2021 | $10,288 | $229,500 | $43,400 | $186,100 |
| 2020 | $10,167 | $229,500 | $43,400 | $186,100 |
| 2019 | $9,928 | $229,500 | $43,400 | $186,100 |
| 2018 | $9,761 | $229,500 | $43,400 | $186,100 |
| 2017 | $9,639 | $229,500 | $43,400 | $186,100 |
| 2016 | $9,453 | $229,500 | $43,400 | $186,100 |
| 2015 | $9,198 | $229,500 | $43,400 | $186,100 |
| 2014 | $8,916 | $229,500 | $43,400 | $186,100 |
Source: Public Records
Map
Nearby Homes