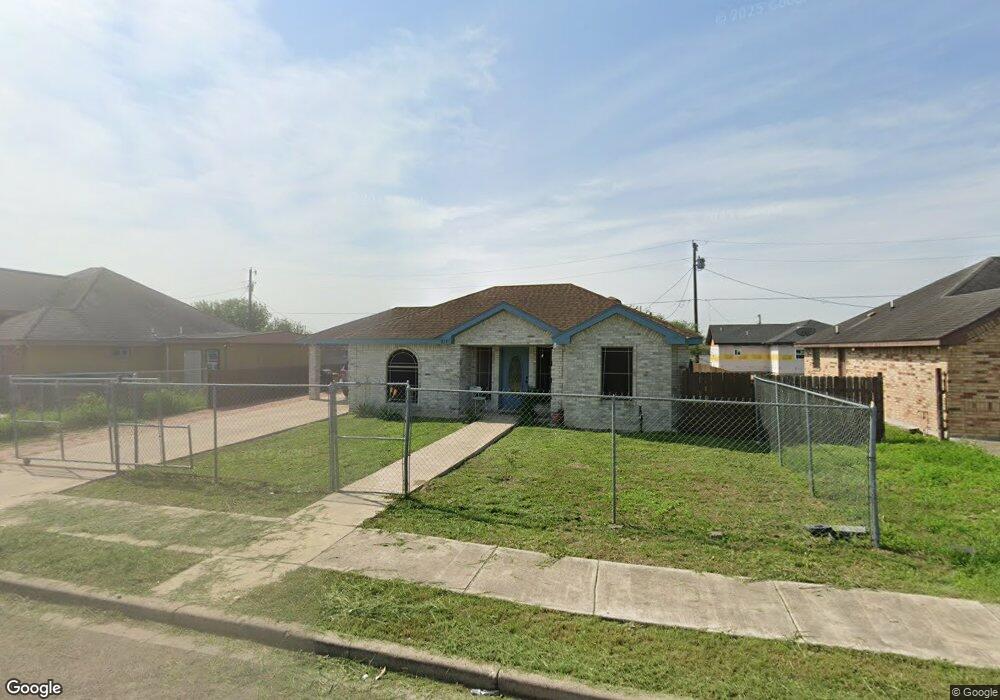
815 Sendero St San Juan, TX 78589
Estimated Value: $138,000 - $156,000
3
Beds
2
Baths
933
Sq Ft
$159/Sq Ft
Est. Value
About This Home
This home is located at 815 Sendero St, San Juan, TX 78589 and is currently estimated at $148,594, approximately $159 per square foot. 815 Sendero St is a home located in Hidalgo County with nearby schools including Amanda Garza-Pena Elementary, Raul H. Yzaguirre Middle School, and PSJA Early College High School.
Ownership History
Date
Name
Owned For
Owner Type
Purchase Details
Closed on
Dec 4, 2017
Sold by
Vincap Properties Lp
Bought by
Vela Jose Enrique
Current Estimated Value
Purchase Details
Closed on
Nov 8, 2017
Sold by
Criminal District Attorney Of Hidalgo Co
Bought by
Vincap Properties Lp
Purchase Details
Closed on
May 31, 2013
Sold by
First National Bank
Bought by
Ruvalcaba Roxana Villanueva
Purchase Details
Closed on
Dec 4, 2012
Sold by
Gutierrez Norman L and Gutierrez Fidencio
Bought by
First National Bank
Purchase Details
Closed on
Feb 3, 2009
Sold by
Velasquez Daniel and Velasquez Juana M
Bought by
First National Bank
Purchase Details
Closed on
Jul 5, 2005
Sold by
Alvarez Cruz and Alvarez Rosalinda Perez
Bought by
Fletcher Group Joint Venture No 2
Create a Home Valuation Report for This Property
The Home Valuation Report is an in-depth analysis detailing your home's value as well as a comparison with similar homes in the area
Home Values in the Area
Average Home Value in this Area
Purchase History
| Date | Buyer | Sale Price | Title Company |
|---|---|---|---|
| Vela Jose Enrique | -- | None Available | |
| Vincap Properties Lp | -- | Edwards Abstract And Title C | |
| Ruvalcaba Roxana Villanueva | -- | None Available | |
| First National Bank | $66,994 | None Available | |
| First National Bank | $69,668 | None Available | |
| Fletcher Group Joint Venture No 2 | $11,676 | None Available |
Source: Public Records
Tax History Compared to Growth
Tax History
| Year | Tax Paid | Tax Assessment Tax Assessment Total Assessment is a certain percentage of the fair market value that is determined by local assessors to be the total taxable value of land and additions on the property. | Land | Improvement |
|---|---|---|---|---|
| 2025 | $3,572 | $131,106 | $45,045 | $86,061 |
| 2024 | $3,572 | $137,851 | $45,045 | $92,806 |
| 2023 | $3,750 | $144,841 | $38,745 | $106,096 |
| 2022 | $3,440 | $124,472 | $28,980 | $95,492 |
| 2021 | $2,724 | $96,363 | $26,460 | $69,903 |
| 2020 | $2,261 | $78,675 | $22,680 | $55,995 |
| 2019 | $2,229 | $74,764 | $22,680 | $52,084 |
| 2018 | $2,258 | $75,331 | $22,050 | $53,281 |
| 2017 | $2,291 | $75,931 | $22,050 | $53,881 |
| 2016 | $2,198 | $72,848 | $19,530 | $53,318 |
| 2015 | $2,071 | $73,448 | $19,530 | $53,918 |
Source: Public Records
Map
Nearby Homes
- 814 Gomez St
- 904 Gonzalez Dr
- 913 Brecha Dr
- 1100 Washingtonia Palm Ave
- 1322 Washingtonia Palm Ave
- 904 El Campo Dr
- 1313 E Evergreen St E
- 1003 Short Rd
- 311 E Salazar St
- 1318 Coconut Palm Ave
- 1107 San Ramon St
- 345 Merida Ave
- 700 E Fm 495
- 00 Cesar Chavez Rd
- 1103 San Cristobal St
- 408 N Cesar Chavez Rd
- 309 E Salazar St
- 312 E Pino St
- 310 E Pino St
- 305 E Salazar St