Estimated Value: $265,000 - $396,000
4
Beds
2
Baths
1,569
Sq Ft
$196/Sq Ft
Est. Value
About This Home
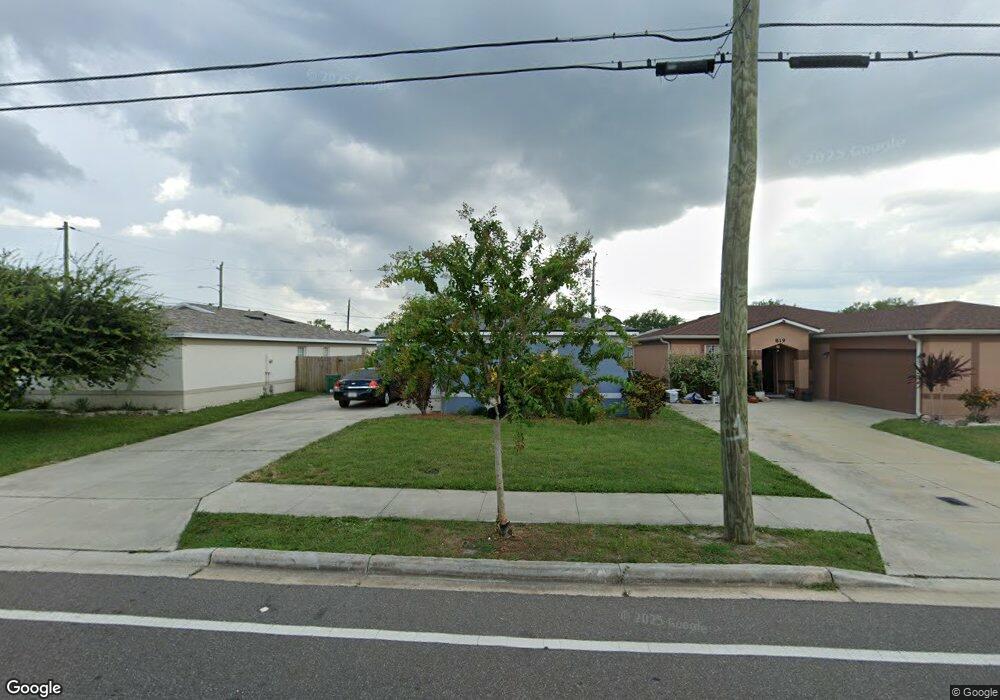
This home is located at 815 Stone St, Cocoa, FL 32922 and is currently estimated at $308,031, approximately $196 per square foot. 815 Stone St is a home located in Brevard County with nearby schools including Endeavour Elementary Magnet, Ronald McNair Magnet Middle School, and Rockledge Senior High School.
Ownership History
Date
Name
Owned For
Owner Type
Purchase Details
Closed on
Mar 24, 2006
Sold by
Progressive Communities Of Cocoa Inc
Bought by
Williams Kenyada P
Current Estimated Value
Home Financials for this Owner
Home Financials are based on the most recent Mortgage that was taken out on this home.
Original Mortgage
$30,000
Outstanding Balance
$17,110
Interest Rate
6.23%
Mortgage Type
Unknown
Estimated Equity
$290,921
Create a Home Valuation Report for This Property
The Home Valuation Report is an in-depth analysis detailing your home's value as well as a comparison with similar homes in the area
Home Values in the Area
Average Home Value in this Area
Purchase History
| Date | Buyer | Sale Price | Title Company |
|---|---|---|---|
| Williams Kenyada P | -- | Fidelity Natl Title Ins Co | |
| Williams Kenyada P | $173,300 | Fidelity Natl Title Ins Co |
Source: Public Records
Mortgage History
| Date | Status | Borrower | Loan Amount |
|---|---|---|---|
| Open | Williams Kenyada P | $30,000 | |
| Open | Williams Kenyada P | $86,200 | |
| Closed | Williams Kenyada P | $57,000 |
Source: Public Records
Tax History
| Year | Tax Paid | Tax Assessment Tax Assessment Total Assessment is a certain percentage of the fair market value that is determined by local assessors to be the total taxable value of land and additions on the property. | Land | Improvement |
|---|---|---|---|---|
| 2025 | $1,410 | $98,300 | -- | -- |
| 2024 | $1,361 | $95,530 | -- | -- |
| 2023 | $1,361 | $92,750 | $0 | $0 |
| 2022 | $1,233 | $90,050 | $0 | $0 |
| 2021 | $1,210 | $87,430 | $0 | $0 |
| 2020 | $1,172 | $86,230 | $0 | $0 |
| 2019 | $1,139 | $84,300 | $0 | $0 |
| 2018 | $1,013 | $82,730 | $0 | $0 |
| 2017 | $1,001 | $81,030 | $0 | $0 |
| 2016 | $987 | $79,370 | $4,000 | $75,370 |
| 2015 | $995 | $78,820 | $4,000 | $74,820 |
| 2014 | $940 | $78,200 | $4,000 | $74,200 |
Source: Public Records
Map
Nearby Homes
- 000 Unknown Ln
- 821 Peachtree St Unit D3
- 506 Stone St
- 93 Prospect Ave
- Xxxx S Fiske Blvd
- 535 Bernard St
- 515 S Wilson Ave
- 714 Johnson St
- 618 S Varr Ave
- 610 Paw St
- 614 Paw St
- 633 S Varr Ave
- 0 W State Road 520 - Lot #24
- 1051 Grove Ave
- 00 S Georgia Ave
- 817 Paw St
- 801 Washington Ave
- 621 S Georgia Ave
- 1127 Grove Ave
- 714 S Georgia Ave
Your Personal Tour Guide
Ask me questions while you tour the home.