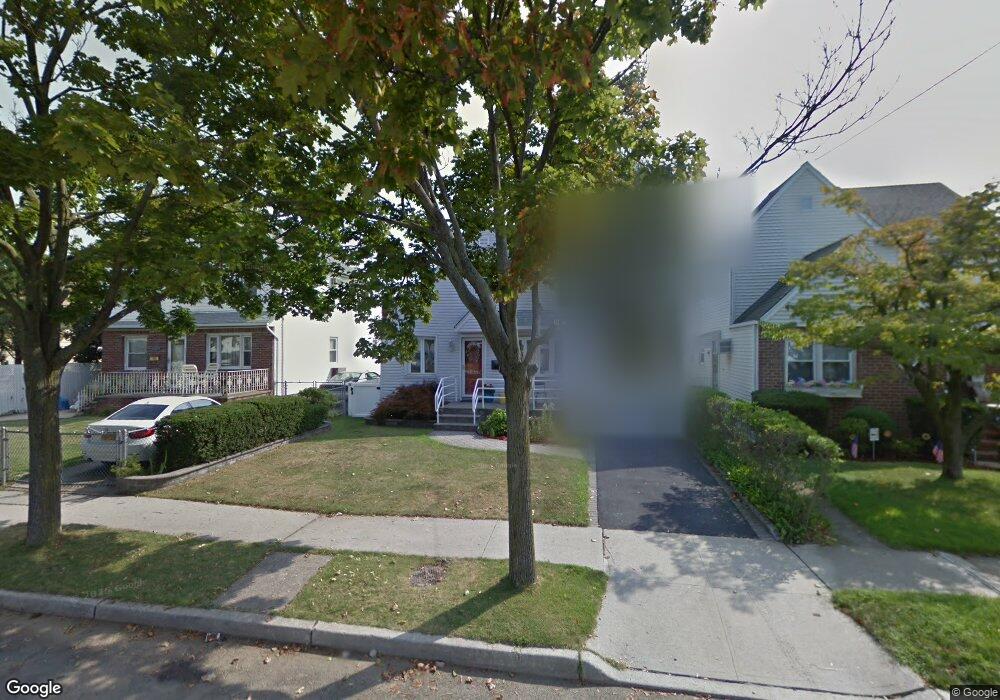
8151 260th St Glen Oaks, NY 11004
Estimated Value: $783,599 - $901,000
--
Bed
--
Bath
1,000
Sq Ft
$840/Sq Ft
Est. Value
About This Home
This home is located at 8151 260th St, Glen Oaks, NY 11004 and is currently estimated at $840,400, approximately $840 per square foot. 8151 260th St is a home located in Queens County with nearby schools including P.S.115Q James J Ambrose School, Fremont/Hay Elementary School, and Irwin Altman Middle School 172.
Ownership History
Date
Name
Owned For
Owner Type
Purchase Details
Closed on
Aug 11, 2023
Sold by
Valencia Ruth
Bought by
The Ruth Noemi Valencia Revocable Trust and Valencia Trustee Ruth Noemi
Current Estimated Value
Purchase Details
Closed on
Jan 29, 2019
Sold by
Licata Bridgett M and Licata Donald N
Bought by
Valencia Ruth
Home Financials for this Owner
Home Financials are based on the most recent Mortgage that was taken out on this home.
Original Mortgage
$489,000
Interest Rate
4.6%
Mortgage Type
New Conventional
Purchase Details
Closed on
Mar 1, 2012
Sold by
Eaton Edward J and Eaton Judith A
Bought by
Licata Bridgett M and Licata Donald N
Home Financials for this Owner
Home Financials are based on the most recent Mortgage that was taken out on this home.
Original Mortgage
$250,100
Interest Rate
3.95%
Mortgage Type
New Conventional
Create a Home Valuation Report for This Property
The Home Valuation Report is an in-depth analysis detailing your home's value as well as a comparison with similar homes in the area
Home Values in the Area
Average Home Value in this Area
Purchase History
| Date | Buyer | Sale Price | Title Company |
|---|---|---|---|
| The Ruth Noemi Valencia Revocable Trust | -- | -- | |
| Valencia Ruth | $639,000 | -- | |
| Licata Bridgett M | $450,000 | -- |
Source: Public Records
Mortgage History
| Date | Status | Borrower | Loan Amount |
|---|---|---|---|
| Previous Owner | Valencia Ruth | $489,000 | |
| Previous Owner | Licata Bridgett M | $250,100 |
Source: Public Records
Tax History Compared to Growth
Tax History
| Year | Tax Paid | Tax Assessment Tax Assessment Total Assessment is a certain percentage of the fair market value that is determined by local assessors to be the total taxable value of land and additions on the property. | Land | Improvement |
|---|---|---|---|---|
| 2025 | $7,410 | $39,106 | $13,796 | $25,310 |
| 2024 | $7,410 | $36,893 | $12,428 | $24,465 |
| 2023 | $7,124 | $35,471 | $13,134 | $22,337 |
| 2022 | $7,204 | $37,680 | $15,240 | $22,440 |
| 2021 | $7,109 | $36,000 | $15,240 | $20,760 |
| 2020 | $5,212 | $37,020 | $15,240 | $21,780 |
| 2019 | $6,431 | $40,800 | $15,240 | $25,560 |
| 2018 | $5,728 | $29,559 | $13,651 | $15,908 |
| 2017 | $5,726 | $29,559 | $13,701 | $15,858 |
| 2016 | $5,318 | $29,559 | $13,701 | $15,858 |
| 2015 | $3,144 | $27,157 | $15,921 | $11,236 |
| 2014 | $3,144 | $25,620 | $16,920 | $8,700 |
Source: Public Records
Map
Nearby Homes