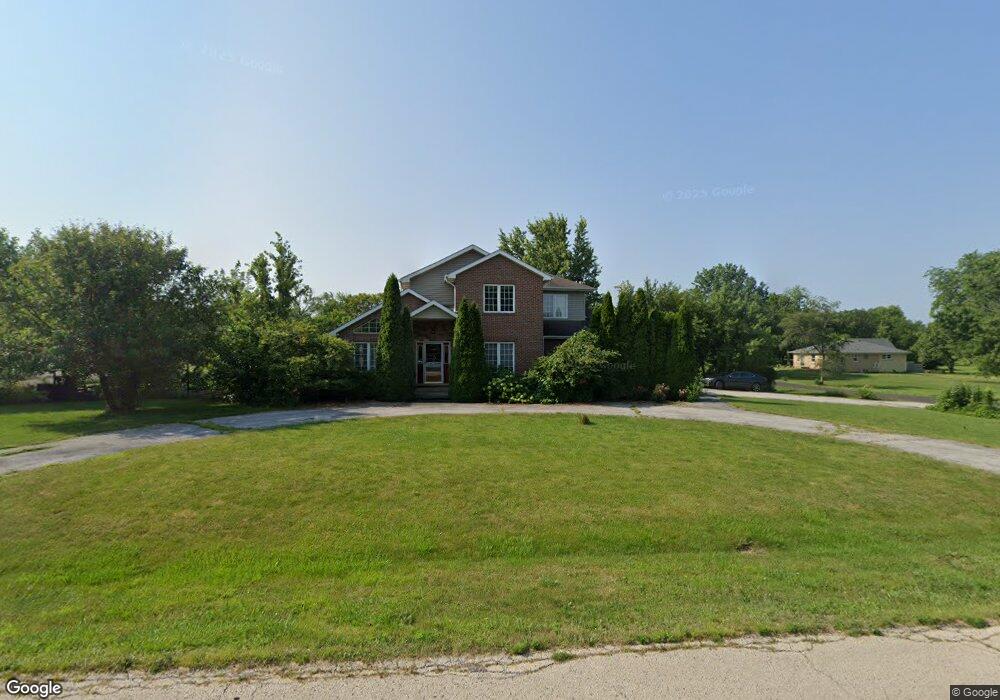
8153 W Hill Ave Frankfort, IL 60423
Frankfort Square NeighborhoodEstimated Value: $549,000 - $611,000
5
Beds
3
Baths
2,767
Sq Ft
$208/Sq Ft
Est. Value
About This Home
This home is located at 8153 W Hill Ave, Frankfort, IL 60423 and is currently estimated at $575,369, approximately $207 per square foot. 8153 W Hill Ave is a home located in Will County with nearby schools including Indian Trail Elementary School, Summit Hill Junior High School, and Lincoln-Way East High School.
Ownership History
Date
Name
Owned For
Owner Type
Purchase Details
Closed on
Feb 22, 2007
Sold by
Cullinan Joseph P and Cullinan Barbara L
Bought by
Barrett Daniel K and Barrett Abigail
Current Estimated Value
Home Financials for this Owner
Home Financials are based on the most recent Mortgage that was taken out on this home.
Original Mortgage
$312,000
Outstanding Balance
$187,601
Interest Rate
6.23%
Mortgage Type
Purchase Money Mortgage
Estimated Equity
$387,768
Purchase Details
Closed on
Jun 14, 2002
Sold by
South Holland Trust & Svgs Bank
Bought by
Cullinan Joseph P and Cullinan Barbara L
Purchase Details
Closed on
Feb 12, 2001
Sold by
Interstate Bank
Bought by
South Holland Trust & Svgs Bank and Trust #1-123
Home Financials for this Owner
Home Financials are based on the most recent Mortgage that was taken out on this home.
Original Mortgage
$477,000
Interest Rate
7.82%
Purchase Details
Closed on
May 19, 2000
Sold by
Odriscoll Daniel J and Odriscoll Mary E
Bought by
Interstate Bank and Trust #99302
Create a Home Valuation Report for This Property
The Home Valuation Report is an in-depth analysis detailing your home's value as well as a comparison with similar homes in the area
Home Values in the Area
Average Home Value in this Area
Purchase History
| Date | Buyer | Sale Price | Title Company |
|---|---|---|---|
| Barrett Daniel K | $390,000 | Ticor Title | |
| Cullinan Joseph P | $240,000 | -- | |
| South Holland Trust & Svgs Bank | -- | Chicago Title Insurance Co | |
| Interstate Bank | $58,000 | -- |
Source: Public Records
Mortgage History
| Date | Status | Borrower | Loan Amount |
|---|---|---|---|
| Open | Barrett Daniel K | $312,000 | |
| Previous Owner | South Holland Trust & Svgs Bank | $477,000 |
Source: Public Records
Tax History Compared to Growth
Tax History
| Year | Tax Paid | Tax Assessment Tax Assessment Total Assessment is a certain percentage of the fair market value that is determined by local assessors to be the total taxable value of land and additions on the property. | Land | Improvement |
|---|---|---|---|---|
| 2024 | $14,856 | $184,132 | $36,329 | $147,803 |
| 2023 | $14,856 | $164,447 | $32,445 | $132,002 |
| 2022 | $14,382 | $149,783 | $29,552 | $120,231 |
| 2021 | $12,322 | $140,128 | $27,647 | $112,481 |
| 2020 | $12,138 | $136,179 | $26,868 | $109,311 |
| 2019 | $11,739 | $132,534 | $26,149 | $106,385 |
| 2018 | $11,314 | $128,724 | $25,397 | $103,327 |
| 2017 | $11,081 | $125,719 | $24,804 | $100,915 |
| 2016 | $10,746 | $121,409 | $23,954 | $97,455 |
| 2015 | $10,368 | $117,133 | $23,110 | $94,023 |
| 2014 | $10,368 | $116,318 | $22,949 | $93,369 |
| 2013 | $10,368 | $117,827 | $23,247 | $94,580 |
Source: Public Records
Map
Nearby Homes
- 8340 W Lincoln Hwy
- 21122 S Hillside Rd
- 8237 Auburn Ln
- 21257 S 79th Ave
- 8638 Saddlebred Ct Unit 24
- 8310 Auburn Ln
- 20530 Torrey Ct
- 7626 W Hickory Creek Dr
- 8631 Saddlebred Ct Unit 75
- 20552 S Frankfort Square Rd
- 8675 Saddlebred Ct Unit 51
- 8667 Saddlebred Ct Unit 10-3
- 8679 Cullen Dr
- 20301 S Pine Hill Rd Unit 1D
- 20301 S Pine Hill Rd Unit 3A
- 21341 Windy Hill Dr Unit 1
- 20513 S Acorn Ridge Dr
- 7639 W Juniper Ct
- 21437 Breton Rd
- 8643 Shire Ct
- 8133 W Hill Ave
- 20765 S 82nd Ave
- 8139 W Duane Dr
- 20860 S 82nd Ave
- 8133 W Duane Dr
- 20759 S 82nd Ave
- 8127 W Duane Dr
- 8125 W Hill Ave
- 8121 W Duane Dr
- 20921 S 82nd Ave
- 8115 W Duane Dr
- 20760 S 82nd Ave
- 8103 W Hill Ave
- 20918 S 82nd Ave
- 8109 W Duane Dr
- 20754 S 82nd Ave
- 8103 W Duane Dr
- 20937 S 82nd Ave
- 20748 S 82nd Ave
- 8061 W Hill Ave