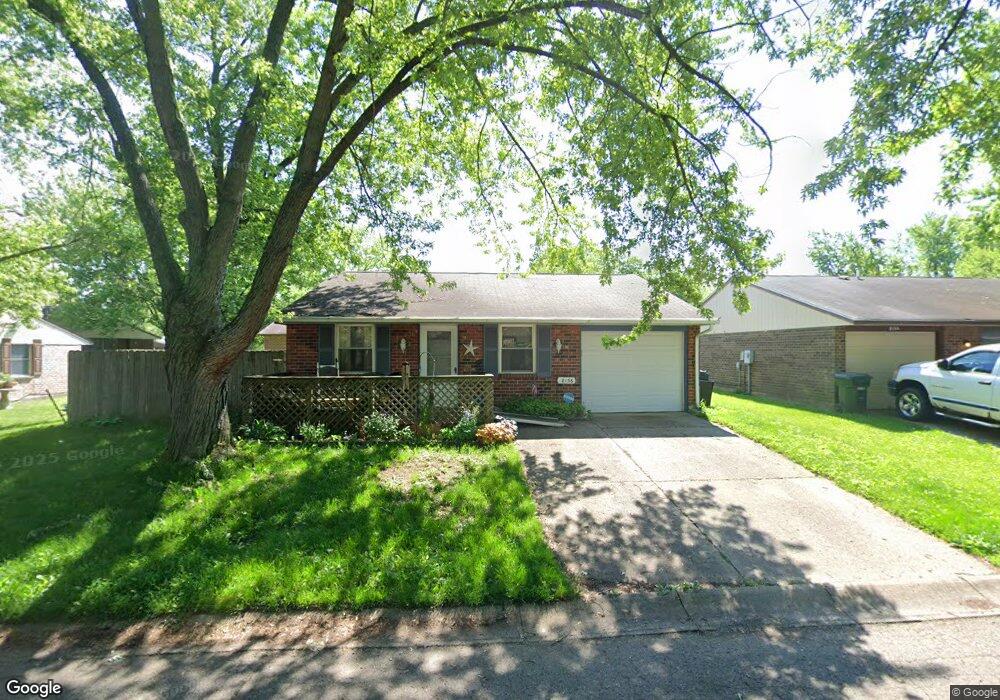
8156 Mount Charles Dr Dayton, OH 45424
Estimated Value: $124,000 - $154,000
3
Beds
1
Bath
915
Sq Ft
$151/Sq Ft
Est. Value
About This Home
This home is located at 8156 Mount Charles Dr, Dayton, OH 45424 and is currently estimated at $137,976, approximately $150 per square foot. 8156 Mount Charles Dr is a home located in Montgomery County with nearby schools including Wayne High School and Huber Heights Christian Academy.
Ownership History
Date
Name
Owned For
Owner Type
Purchase Details
Closed on
Jun 14, 2022
Sold by
Woods Eleanor J
Bought by
Woods Eleanor J and Woods Paul J
Current Estimated Value
Purchase Details
Closed on
Apr 7, 2003
Sold by
Petrequin Brian K and Petrequin Regina
Bought by
Woods Eleanor J
Home Financials for this Owner
Home Financials are based on the most recent Mortgage that was taken out on this home.
Original Mortgage
$68,161
Interest Rate
5.76%
Mortgage Type
FHA
Purchase Details
Closed on
Aug 23, 1999
Sold by
Reineke David M and Reineke Christine S
Bought by
Petrequin Brian K
Home Financials for this Owner
Home Financials are based on the most recent Mortgage that was taken out on this home.
Original Mortgage
$54,625
Interest Rate
7.77%
Purchase Details
Closed on
May 17, 1996
Sold by
University Of Dayton
Bought by
Reineke David M and Reineke Christine S
Create a Home Valuation Report for This Property
The Home Valuation Report is an in-depth analysis detailing your home's value as well as a comparison with similar homes in the area
Home Values in the Area
Average Home Value in this Area
Purchase History
| Date | Buyer | Sale Price | Title Company |
|---|---|---|---|
| Woods Eleanor J | -- | None Listed On Document | |
| Woods Eleanor J | $68,700 | -- | |
| Petrequin Brian K | $57,500 | -- | |
| Reineke David M | $45,000 | -- |
Source: Public Records
Mortgage History
| Date | Status | Borrower | Loan Amount |
|---|---|---|---|
| Previous Owner | Woods Eleanor J | $68,161 | |
| Previous Owner | Petrequin Brian K | $54,625 |
Source: Public Records
Tax History Compared to Growth
Tax History
| Year | Tax Paid | Tax Assessment Tax Assessment Total Assessment is a certain percentage of the fair market value that is determined by local assessors to be the total taxable value of land and additions on the property. | Land | Improvement |
|---|---|---|---|---|
| 2024 | $1,142 | $31,280 | $10,150 | $21,130 |
| 2023 | $1,142 | $31,280 | $10,150 | $21,130 |
| 2022 | $852 | $21,560 | $7,000 | $14,560 |
| 2021 | $855 | $21,560 | $7,000 | $14,560 |
| 2020 | $853 | $21,560 | $7,000 | $14,560 |
| 2019 | $775 | $18,980 | $8,750 | $10,230 |
| 2018 | $777 | $18,980 | $8,750 | $10,230 |
| 2017 | $772 | $18,980 | $8,750 | $10,230 |
| 2016 | $679 | $17,490 | $8,750 | $8,740 |
| 2015 | $671 | $17,490 | $8,750 | $8,740 |
| 2014 | $671 | $17,490 | $8,750 | $8,740 |
| 2012 | -- | $17,660 | $8,750 | $8,910 |
Source: Public Records
Map
Nearby Homes
- 7833 Harshmanville Rd
- 7500 Mount Ranier Unit 12077
- 7866 Harshmanville Rd
- 6150 Taylorsville Rd
- 6447 Highbury Rd
- 6089 Green Knolls Dr
- 5580 Clagston Ct
- 8436 Indian Mound Dr
- 7371 Damascus Dr
- 5582 Camerford Dr
- 8282 Briar Ridge Ct
- 6219 Beacon Tree Ct
- 7150 Harshmanville Rd
- 6681 Spokane Dr
- 6334 Shull Rd
- 6701 Springport Way
- 8554 Schoolgate Dr
- 6605 Highbury Rd
- 5631 Longford Rd
- 7126 Mandrake Dr
- 8150 Mount Charles Dr
- 8167 Mount Washington Dr
- 8157 Mount Washington Dr
- 8164 Mount Charles Dr
- 8149 Mount Mansfield Dr
- 8149 Mount Washington Dr
- 8173 Mount Washington Dr
- 8140 Mount Charles Dr
- 8159 Mount Mansfield Dr
- 8172 Mount Charles Dr
- 8143 Mount Mansfield Dr
- 8141 Mount Washington Dr
- 8196 Mount Mansfield Dr
- 8188 Mount Mansfield Dr
- 8158 Mount Washington Dr
- 8132 Mount Charles Dr
- 8181 Mount Washington Dr
- 8150 Mount Washington Dr
- 8135 Mount Mansfield Dr
- 8178 Mount Mansfield Dr