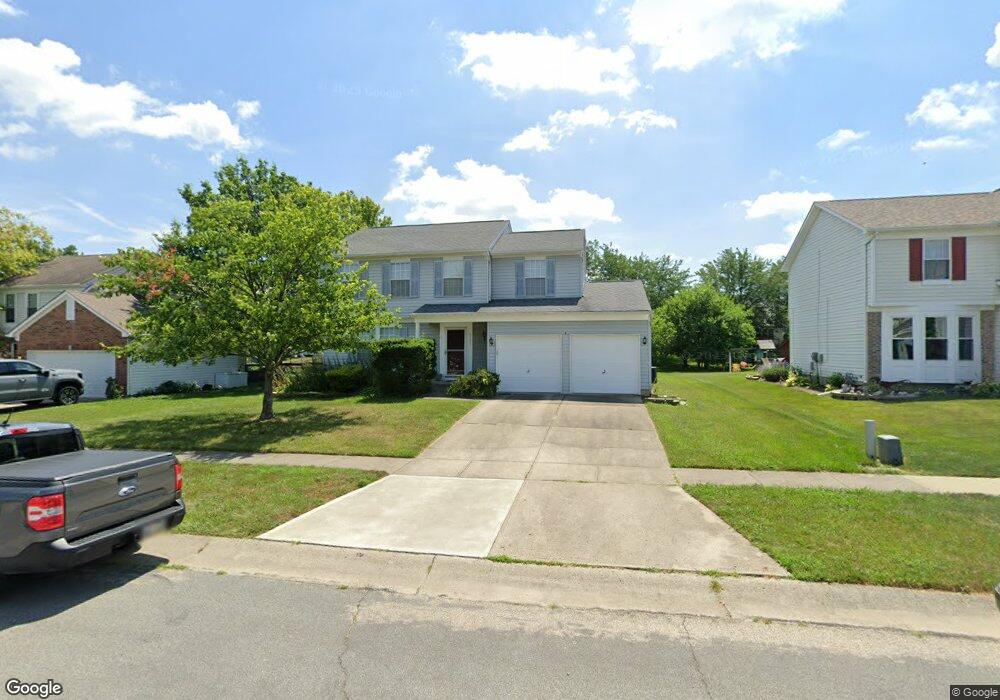
8158 Indian Summer Way Mason, OH 45040
Deerfield Township NeighborhoodEstimated Value: $398,000 - $433,000
4
Beds
3
Baths
1,786
Sq Ft
$235/Sq Ft
Est. Value
About This Home
This home is located at 8158 Indian Summer Way, Mason, OH 45040 and is currently estimated at $419,877, approximately $235 per square foot. 8158 Indian Summer Way is a home located in Warren County with nearby schools including Mason Intermediate Elementary School, Mason Middle School, and William Mason High School.
Ownership History
Date
Name
Owned For
Owner Type
Purchase Details
Closed on
Oct 26, 2004
Sold by
Pyles David M and Pyles Deborah A
Bought by
Dai Hong Jian
Current Estimated Value
Home Financials for this Owner
Home Financials are based on the most recent Mortgage that was taken out on this home.
Original Mortgage
$134,400
Interest Rate
5.81%
Mortgage Type
Purchase Money Mortgage
Purchase Details
Closed on
Jul 8, 1998
Sold by
Kisker Gary J
Bought by
Pyles David M and Pyles Deborah A
Home Financials for this Owner
Home Financials are based on the most recent Mortgage that was taken out on this home.
Original Mortgage
$124,200
Interest Rate
7.17%
Mortgage Type
New Conventional
Purchase Details
Closed on
Dec 31, 1992
Bought by
Kisker and Kisker Gary J
Purchase Details
Closed on
Nov 2, 1992
Bought by
Ryland Group & Inc.
Purchase Details
Closed on
Mar 10, 1989
Sold by
A J & R Development Co
Bought by
A J & R Development Co
Create a Home Valuation Report for This Property
The Home Valuation Report is an in-depth analysis detailing your home's value as well as a comparison with similar homes in the area
Home Values in the Area
Average Home Value in this Area
Purchase History
| Date | Buyer | Sale Price | Title Company |
|---|---|---|---|
| Dai Hong Jian | $168,000 | -- | |
| Pyles David M | $138,000 | -- | |
| Kisker | $113,300 | -- | |
| Ryland Group & Inc. | -- | -- | |
| A J & R Development Co | -- | -- |
Source: Public Records
Mortgage History
| Date | Status | Borrower | Loan Amount |
|---|---|---|---|
| Previous Owner | Dai Hong Jian | $134,400 | |
| Previous Owner | Pyles David M | $124,200 | |
| Closed | Dai Hong Jian | $16,800 |
Source: Public Records
Tax History Compared to Growth
Tax History
| Year | Tax Paid | Tax Assessment Tax Assessment Total Assessment is a certain percentage of the fair market value that is determined by local assessors to be the total taxable value of land and additions on the property. | Land | Improvement |
|---|---|---|---|---|
| 2024 | $4,677 | $109,010 | $31,500 | $77,510 |
| 2023 | $4,356 | $83,639 | $16,712 | $66,927 |
| 2022 | $4,281 | $83,640 | $16,713 | $66,927 |
| 2021 | $4,073 | $83,640 | $16,713 | $66,927 |
| 2020 | $3,997 | $69,699 | $13,927 | $55,773 |
| 2019 | $3,705 | $69,699 | $13,927 | $55,773 |
| 2018 | $3,681 | $69,699 | $13,927 | $55,773 |
| 2017 | $3,350 | $57,827 | $12,740 | $45,087 |
| 2016 | $3,443 | $57,827 | $12,740 | $45,087 |
| 2015 | $3,184 | $57,827 | $12,740 | $45,087 |
| 2014 | $3,184 | $49,850 | $10,980 | $38,870 |
| 2013 | $3,191 | $63,230 | $13,930 | $49,300 |
Source: Public Records
Map
Nearby Homes
- 8224 Summer View Dr
- 8606 Charleston Valley Dr
- 6589 Quail Lake
- 6374 Hunters Green Dr
- 8655 Charleston Creek Dr
- 6930 Walnut Meadows Dr
- 7839 Meadowbrook Dr
- Margot Plan at Losh Landing - Masterpiece Collection
- Mitchell Plan at Losh Landing - Masterpiece Collection
- Clay Plan at Losh Landing - Masterpiece Collection
- Huxley Plan at Losh Landing - Masterpiece Collection
- Leland Plan at Losh Landing - Masterpiece Collection
- Beckett Plan at Losh Landing - Masterpiece Collection
- Paxton Plan at Losh Landing - Masterpiece Collection
- Winslow Plan at Losh Landing - Masterpiece Collection
- Teagan Plan at Losh Landing - Masterpiece Collection
- Pearson Plan at Losh Landing - Masterpiece Collection
- 8905 Suncrest Ln
- 9302 W Meadow Dr
- 0 Castle Dr Unit 1837833
- 8148 Indian Summer Way
- 8170 Indian Summer Way
- 8136 Indian Summer Way
- 8180 Indian Summer Way
- 8221 Summer View Dr
- 8165 Indian Summer Way
- 8211 Summer View Dr
- 8231 Summer View Dr
- 8177 Indian Summer Way
- 6816 Autumn Mist Ct
- 8199 Summer View Dr
- 8126 Indian Summer Way
- 8185 Summer View Dr
- 8192 Indian Summer Way
- 8127 Indian Summer Way
- 6835 Autumn Mist Ct
- 8243 Summer View Dr
- 8114 Indian Summer Way
- 8115 Indian Summer Way
- 8173 Summer View Dr