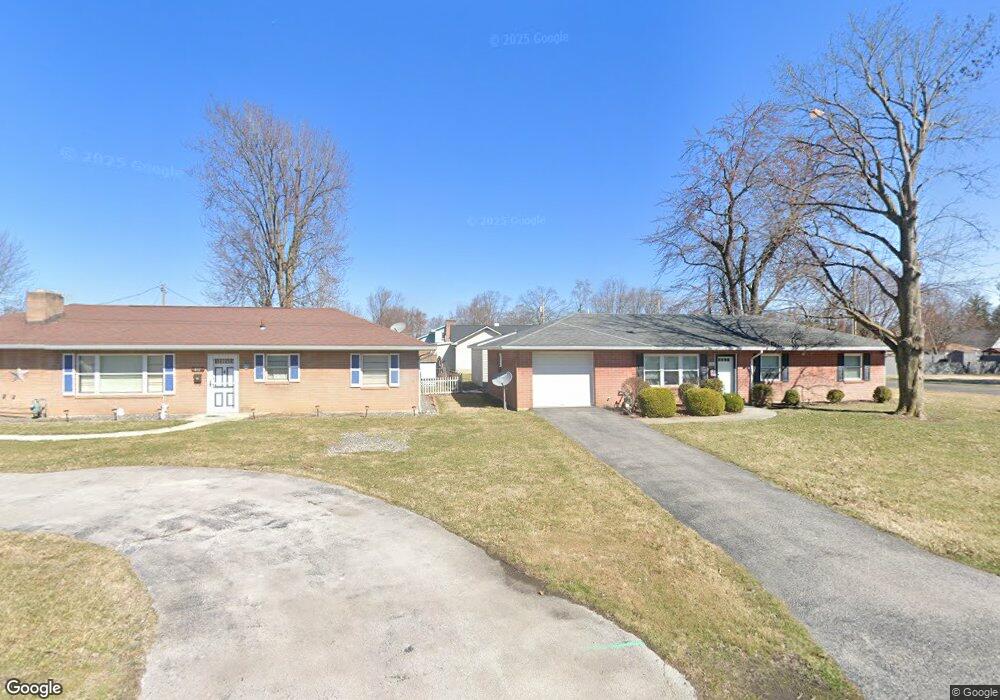
816 5th St Findlay, OH 45840
Estimated Value: $147,516 - $179,000
3
Beds
1
Bath
960
Sq Ft
$171/Sq Ft
Est. Value
About This Home
This home is located at 816 5th St, Findlay, OH 45840 and is currently estimated at $164,129, approximately $170 per square foot. 816 5th St is a home located in Hancock County with nearby schools including Whittier Elementary School, Wilson Vance Elementary School, and Donnell Middle School.
Ownership History
Date
Name
Owned For
Owner Type
Purchase Details
Closed on
Aug 12, 2022
Sold by
Paul And Janet Gilson Revocable Living T
Bought by
Ahmed I El-Zayaty Inter-Vivosrevocable Trust and Hanaa M El-Zayaty Inter-Vivos Revocable Trust
Current Estimated Value
Purchase Details
Closed on
Mar 24, 2017
Sold by
Breitigam Joshua A
Bought by
Gilson Paul and Gilson Janet
Purchase Details
Closed on
Oct 9, 2009
Sold by
Osborne Jeffrey K and Osborne Pamela M
Bought by
Breitigam Joshuah A
Home Financials for this Owner
Home Financials are based on the most recent Mortgage that was taken out on this home.
Original Mortgage
$80,000
Interest Rate
5.19%
Mortgage Type
New Conventional
Purchase Details
Closed on
Mar 1, 1988
Bought by
Johns William M
Purchase Details
Closed on
Jun 27, 1986
Bought by
Burge Bruce A and Burge Christy A
Create a Home Valuation Report for This Property
The Home Valuation Report is an in-depth analysis detailing your home's value as well as a comparison with similar homes in the area
Home Values in the Area
Average Home Value in this Area
Purchase History
| Date | Buyer | Sale Price | Title Company |
|---|---|---|---|
| Ahmed I El-Zayaty Inter-Vivosrevocable Trust | -- | Kuenzli Drake Phillips | |
| Ahmed I El-Zayaty Inter-Vivosrevocable Trust | -- | Kuenzli Drake Phillips | |
| Gilson Paul | $111,000 | Flag City Title | |
| Breitigam Joshuah A | $100,000 | Whitman Title Security | |
| Johns William M | $42,000 | -- | |
| Burge Bruce A | $42,500 | -- |
Source: Public Records
Mortgage History
| Date | Status | Borrower | Loan Amount |
|---|---|---|---|
| Previous Owner | Breitigam Joshuah A | $80,000 |
Source: Public Records
Tax History
| Year | Tax Paid | Tax Assessment Tax Assessment Total Assessment is a certain percentage of the fair market value that is determined by local assessors to be the total taxable value of land and additions on the property. | Land | Improvement |
|---|---|---|---|---|
| 2024 | $1,239 | $34,000 | $3,990 | $30,010 |
| 2023 | $1,242 | $34,000 | $3,990 | $30,010 |
| 2022 | $1,237 | $34,000 | $3,990 | $30,010 |
| 2021 | $1,030 | $24,650 | $4,690 | $19,960 |
| 2020 | $1,030 | $24,650 | $4,690 | $19,960 |
| 2019 | $1,009 | $24,280 | $4,690 | $19,590 |
| 2018 | $1,086 | $24,280 | $4,690 | $19,590 |
| 2017 | $542 | $24,280 | $4,690 | $19,590 |
| 2016 | $1,051 | $24,280 | $4,690 | $19,590 |
| 2015 | $961 | $21,950 | $4,690 | $17,260 |
| 2014 | $961 | $21,950 | $4,690 | $17,260 |
| 2012 | $925 | $20,940 | $4,690 | $16,250 |
Source: Public Records
Map
Nearby Homes
- 731 5th St
- 1100 Stall Dr
- 1709 Eastview Dr
- 1726 Eastview Dr
- 206 Greenlawn Ave
- 331 Fairlawn Place
- 315 Fairlawn Place
- 0 Blanchard Ave
- 123 Glendale Ave
- 1037 Fishlock Ave
- 216 1st St
- 15591 Canadian Way
- 15586 Canadian Way
- 15615 Canadian Way
- 1200 1st St
- 829 Maple Ave
- 1304 Douglas Pkwy
- 865 S Main St
- 136 E Hobart Ave
- 209 E Hobart Ave
- 810 5th St
- 1314 Graceland Ave
- 804 5th St
- 1404 Graceland Ave
- 811 5th St
- 830 5th St
- 800 5th St
- 1408 Graceland Ave
- 1307 Leiser Ave
- 1401 Graceland Ave
- 1301 Graceland Ave
- 805 5th St
- 1311 Leiser Ave
- 1412 Graceland Ave
- 1300 Graceland Ave
- 827 Sunhaven Rd
- 801 5th St
- 734 5th St
- 1415 Graceland Ave
- 1312 Leiser Ave
Your Personal Tour Guide
Ask me questions while you tour the home.