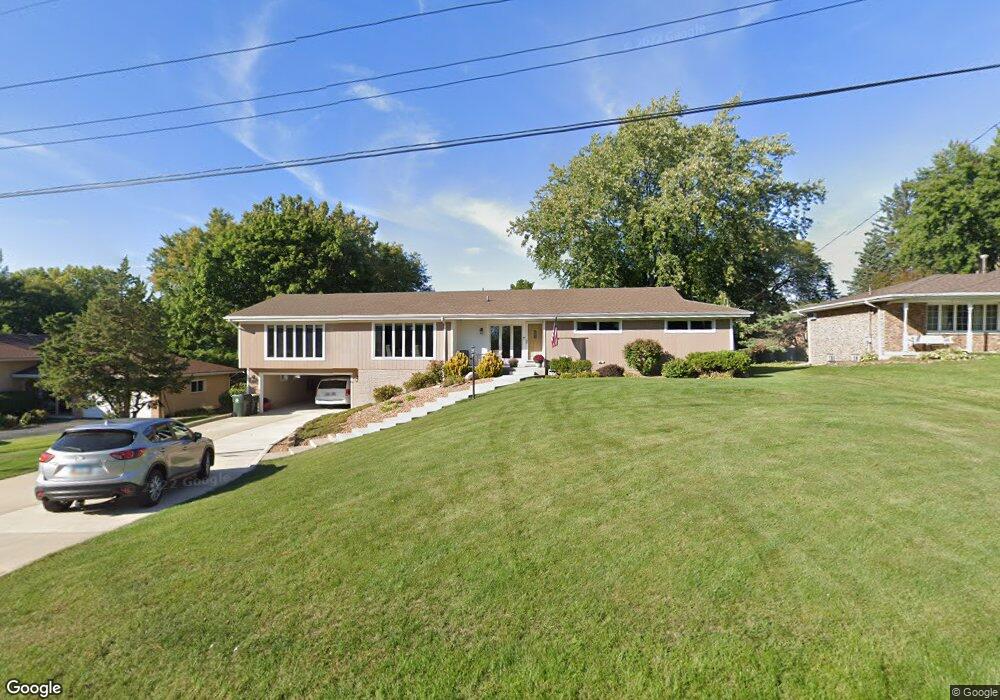
816 80th St Downers Grove, IL 60516
Estimated Value: $519,000 - $587,000
--
Bed
1
Bath
2,275
Sq Ft
$243/Sq Ft
Est. Value
About This Home
This home is located at 816 80th St, Downers Grove, IL 60516 and is currently estimated at $553,488, approximately $243 per square foot. 816 80th St is a home located in DuPage County with nearby schools including Prairieview Elementary School, Elizabeth Ide Elementary School, and Lakeview Jr High School.
Ownership History
Date
Name
Owned For
Owner Type
Purchase Details
Closed on
Jan 25, 2024
Sold by
Ondracek Alison R
Bought by
Alison Ondracek Revocable Living Trust and Ondracek
Current Estimated Value
Purchase Details
Closed on
Jul 23, 1998
Sold by
Eberhard James D and Eberhard Lucretia V
Bought by
Ondracek Mark A and Ondracek Alison R
Home Financials for this Owner
Home Financials are based on the most recent Mortgage that was taken out on this home.
Original Mortgage
$135,000
Interest Rate
7.03%
Purchase Details
Closed on
Jul 26, 1996
Sold by
Jehlik Robert E and Jehlik Linda D
Bought by
Eberhard James D and Eberhard Lucretia V
Home Financials for this Owner
Home Financials are based on the most recent Mortgage that was taken out on this home.
Original Mortgage
$153,000
Interest Rate
6.87%
Create a Home Valuation Report for This Property
The Home Valuation Report is an in-depth analysis detailing your home's value as well as a comparison with similar homes in the area
Home Values in the Area
Average Home Value in this Area
Purchase History
| Date | Buyer | Sale Price | Title Company |
|---|---|---|---|
| Alison Ondracek Revocable Living Trust | -- | None Listed On Document | |
| Ondracek Mark A | $210,000 | -- | |
| Eberhard James D | $200,000 | -- |
Source: Public Records
Mortgage History
| Date | Status | Borrower | Loan Amount |
|---|---|---|---|
| Previous Owner | Ondracek Mark A | $135,000 | |
| Previous Owner | Eberhard James D | $153,000 |
Source: Public Records
Tax History Compared to Growth
Tax History
| Year | Tax Paid | Tax Assessment Tax Assessment Total Assessment is a certain percentage of the fair market value that is determined by local assessors to be the total taxable value of land and additions on the property. | Land | Improvement |
|---|---|---|---|---|
| 2024 | $8,039 | $148,408 | $65,224 | $83,184 |
| 2023 | $7,704 | $136,430 | $59,960 | $76,470 |
| 2022 | $6,204 | $128,580 | $56,510 | $72,070 |
| 2021 | $5,666 | $127,120 | $55,870 | $71,250 |
| 2020 | $6,231 | $124,600 | $54,760 | $69,840 |
| 2019 | $6,041 | $119,550 | $52,540 | $67,010 |
| 2018 | $6,146 | $102,990 | $52,230 | $50,760 |
| 2017 | $5,941 | $99,100 | $50,260 | $48,840 |
| 2016 | $5,626 | $94,580 | $47,970 | $46,610 |
| 2015 | $5,548 | $88,980 | $45,130 | $43,850 |
| 2014 | $5,455 | $86,510 | $43,880 | $42,630 |
| 2013 | $5,564 | $86,100 | $43,670 | $42,430 |
Source: Public Records
Map
Nearby Homes
- 2417 Green Valley Rd
- 7925 Fairmount Ave
- 2611 Woodmere Dr Unit 24
- 7769 Danbury Dr
- 7930 Woodglen Ln Unit 204
- 8000 Woodglen Ln Unit 101
- 2667 Woodmere Dr Unit 44
- 2714 Whitlock Dr
- 512 Redondo Dr Unit 512
- 512 Redondo Dr Unit 112
- 8100 Woodglen Ln Unit 204
- 7911 Hedgewood Dr
- 505 Redondo Dr Unit 308
- 505 Redondo Dr Unit 305
- 9S211 Graceland St
- 502 Redondo Dr Unit 503
- 500 Redondo Dr Unit 409
- 500 Redondo Dr Unit 308
- 7517 Main St
- 2013 Judd St