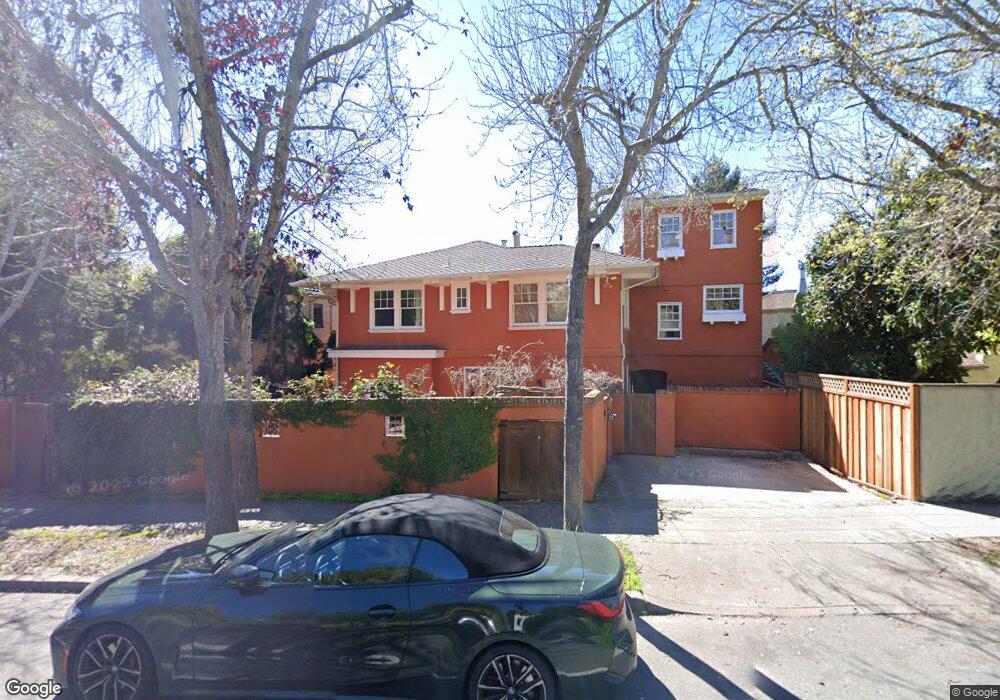
816 Arlington Ave Berkeley, CA 94707
Thousand Oaks NeighborhoodEstimated Value: $2,282,000 - $3,270,596
5
Beds
6
Baths
4,200
Sq Ft
$614/Sq Ft
Est. Value
About This Home
This home is located at 816 Arlington Ave, Berkeley, CA 94707 and is currently estimated at $2,580,649, approximately $614 per square foot. 816 Arlington Ave is a home located in Alameda County with nearby schools including Thousand Oaks Elementary School, Berkeley Arts Magnet at Whittier School, and Ruth Acty Elementary.
Ownership History
Date
Name
Owned For
Owner Type
Purchase Details
Closed on
Jul 20, 2019
Sold by
Shen Christine M
Bought by
Shen Christine Mea and Christine Mae Shen Living Trus
Current Estimated Value
Purchase Details
Closed on
Jun 23, 2006
Sold by
Shen Benjamin C
Bought by
Shen Christine M
Purchase Details
Closed on
May 15, 1998
Sold by
Shen Mayling
Bought by
Shen Benjamin C
Home Financials for this Owner
Home Financials are based on the most recent Mortgage that was taken out on this home.
Original Mortgage
$227,150
Interest Rate
7.13%
Create a Home Valuation Report for This Property
The Home Valuation Report is an in-depth analysis detailing your home's value as well as a comparison with similar homes in the area
Home Values in the Area
Average Home Value in this Area
Purchase History
| Date | Buyer | Sale Price | Title Company |
|---|---|---|---|
| Shen Christine Mea | -- | None Available | |
| Shen Christine M | -- | None Available | |
| Shen Benjamin C | -- | Nortwestern Title Company | |
| Shen Christine M | -- | Nortwestern Title Company | |
| Shen Christine M | $550,000 | Nortwestern Title Company |
Source: Public Records
Mortgage History
| Date | Status | Borrower | Loan Amount |
|---|---|---|---|
| Previous Owner | Shen Christine M | $227,150 |
Source: Public Records
Tax History
| Year | Tax Paid | Tax Assessment Tax Assessment Total Assessment is a certain percentage of the fair market value that is determined by local assessors to be the total taxable value of land and additions on the property. | Land | Improvement |
|---|---|---|---|---|
| 2025 | $20,465 | $871,167 | $263,450 | $614,717 |
| 2024 | $20,465 | $853,953 | $258,286 | $602,667 |
| 2023 | $19,876 | $844,073 | $253,222 | $590,851 |
| 2022 | $19,479 | $820,524 | $248,257 | $579,267 |
| 2021 | $19,442 | $804,298 | $243,389 | $567,909 |
| 2020 | $18,097 | $802,983 | $240,895 | $562,088 |
| 2019 | $17,037 | $787,241 | $236,172 | $551,069 |
| 2018 | $16,635 | $771,808 | $231,542 | $540,266 |
| 2017 | $16,063 | $756,678 | $227,003 | $529,675 |
| 2016 | $15,285 | $741,844 | $222,553 | $519,291 |
| 2015 | $15,018 | $730,701 | $219,210 | $511,491 |
| 2014 | $14,730 | $716,391 | $214,917 | $501,474 |
Source: Public Records
Map
Nearby Homes
- 1983 Yosemite Rd
- 765 San Diego Rd
- 813 San Diego Rd
- 826 Indian Rock Ave
- 758 Spruce St
- 589 San Luis Rd
- 777 Cragmont Ave
- 483 Boynton Ave
- 1950 Hopkins St
- 614 Cragmont Ave
- 1004 Cragmont Ave
- 753 Peralta Ave
- 470 Spruce St
- 606 Grizzly Peak Blvd
- 380 Vermont Ave
- 2121 Eunice St
- 962 Regal Rd
- 731 Santa fe Ave
- 731 Grizzly Peak Blvd
- 415 Berkeley Park Blvd
- 808 Arlington Ave
- 820 Arlington Ave
- 800 Arlington Ave
- 1994 Yosemite Rd
- 828 Arlington Ave
- 805 Contra Costa Ave
- 807 Contra Costa Ave
- 811 Contra Costa Ave
- 815 Contra Costa Ave
- 801 Contra Costa Ave
- 1992 Yosemite Rd
- 817 Arlington Ave
- 825 Contra Costa Ave
- 811 Arlington Ave
- 827 Arlington Ave
- 1986 Yosemite Rd
- 835 Contra Costa Ave
- 799 Contra Costa Ave
- 802 Contra Costa Ave
- 11 Southampton Ave
Your Personal Tour Guide
Ask me questions while you tour the home.