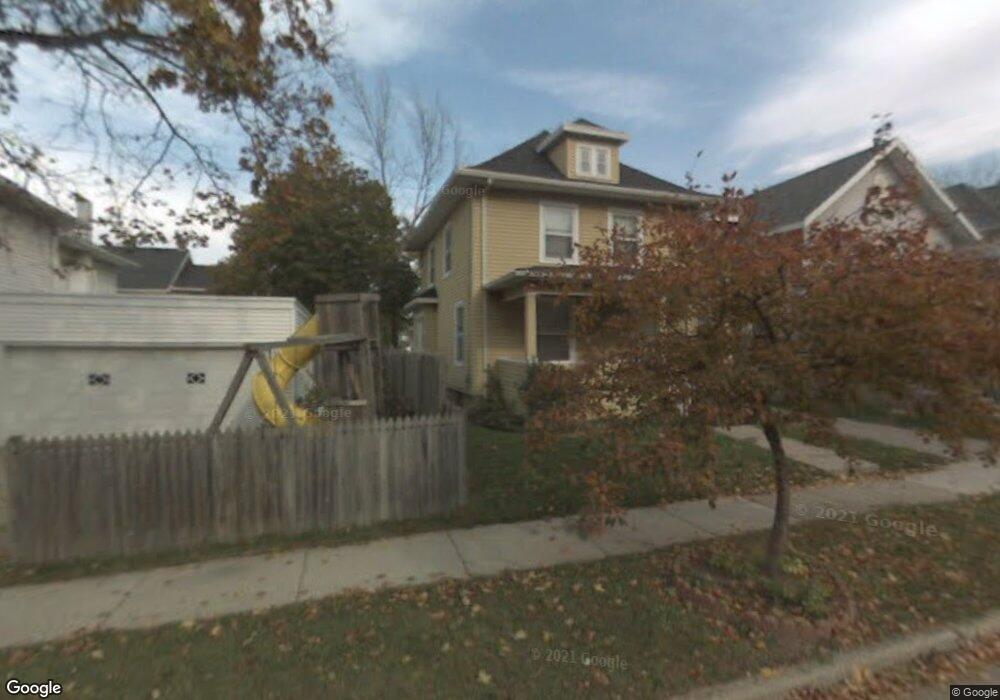
816 Bancroft Ct Lansing, MI 48915
Downtown Lansing NeighborhoodEstimated Value: $98,248 - $116,000
About This Home
This home is located at 816 Bancroft Ct, Lansing, MI 48915 and is currently estimated at $105,562, approximately $85 per square foot. 816 Bancroft Ct is a home located in Ingham County with nearby schools including Riddle Elementary School, Pattengill Academy, and J.W. Sexton High School.
Ownership History
We collect this data history from publicly available records. To have your information removed, we recommend requesting removal directly through your county’s website.
Purchase Details
Purchase Details
Purchase Details
Home Financials for this Owner
Home Financials are based on the most recent Mortgage that was taken out on this home.Purchase Details
Purchase Details
Home Values in the Area
Average Home Value in this Area
Purchase History
We collect this data history from publicly available records. To have your information removed, we recommend requesting removal directly through your county’s website.
| Date | Buyer | Sale Price | Title Company |
|---|---|---|---|
| -- | None Listed On Document | ||
| -- | None Available | ||
| $50,000 | Tri County Title Agency Llc | ||
| -- | Tri County Title Agency Llc | ||
| $270,000 | None Available | ||
| -- | None Available |
Mortgage History
We collect this data history from publicly available records. To have your information removed, we recommend requesting removal directly through your county’s website.
| Date | Status | Borrower | Loan Amount |
|---|---|---|---|
| Previous Owner | $49,500 |
Tax History
We collect this data history from publicly available records. To have your information removed, we recommend requesting removal directly through your county’s website.
| Year | Tax Paid | Tax Assessment Tax Assessment Total Assessment is a certain percentage of the fair market value that is determined by local assessors to be the total taxable value of land and additions on the property. | Land | Improvement |
|---|---|---|---|---|
| 2025 | $2,461 | $49,800 | $2,700 | $47,100 |
| 2024 | $24 | $46,100 | $2,700 | $43,400 |
| 2023 | $2,717 | $41,300 | $2,700 | $38,600 |
| 2022 | $2,481 | $37,100 | $3,100 | $34,000 |
| 2021 | $2,424 | $30,000 | $4,000 | $26,000 |
| 2020 | $2,245 | $27,500 | $4,000 | $23,500 |
| 2019 | $5,112 | $27,300 | $4,000 | $23,300 |
| 2018 | $3,229 | $25,800 | $4,000 | $21,800 |
| 2017 | $1,751 | $25,800 | $4,000 | $21,800 |
| 2016 | $3,112 | $25,300 | $4,000 | $21,300 |
| 2015 | $3,112 | $24,400 | $7,983 | $16,417 |
| 2014 | $3,112 | $25,800 | $11,250 | $14,550 |
Map
- 902 W Lapeer St
- 614 N Butler Blvd
- 616 N Butler Blvd
- 433 N Butler Blvd
- 713 W Lapeer St
- 427 N Butler Blvd
- 425/425.5 N Butler Blvd
- 820 W Shiawassee St
- 429 N Sycamore St
- 902 W Shiawassee St
- 506 N Sycamore St
- 418 N Martin Luther King Junior Blvd
- 917 W Shiawassee St
- 416 N Martin Luther King Junior Blvd
- 745 Chicago Ave
- 737 Princeton Ave
- 325 N Sycamore St
- 734 N Martin Luther King jr Blvd
- 1127 W Saginaw St
- 613 W Shiawassee St
- 812 Bancroft Ct
- 526 N Butler Blvd
- 530 N Butler Blvd
- 810 Bancroft Ct
- 825 W Lapeer St
- 811 W Lapeer St
- 806 Bancroft Ct
- 823 Bancroft Ct
- 804 Bancroft Ct
- 817 Bancroft Ct
- 807 W Lapeer St
- 514 N Butler Blvd Unit 1
- 800 Bancroft Ct
- 809 Bancroft Ct
- 510 N Butler Blvd
- 814 W Lapeer St
- 738 Bancroft Ct Unit 1
- 816 W Lapeer St
- 820 W Lapeer St
- 533 N Butler Blvd
Ask me questions while you tour the home.