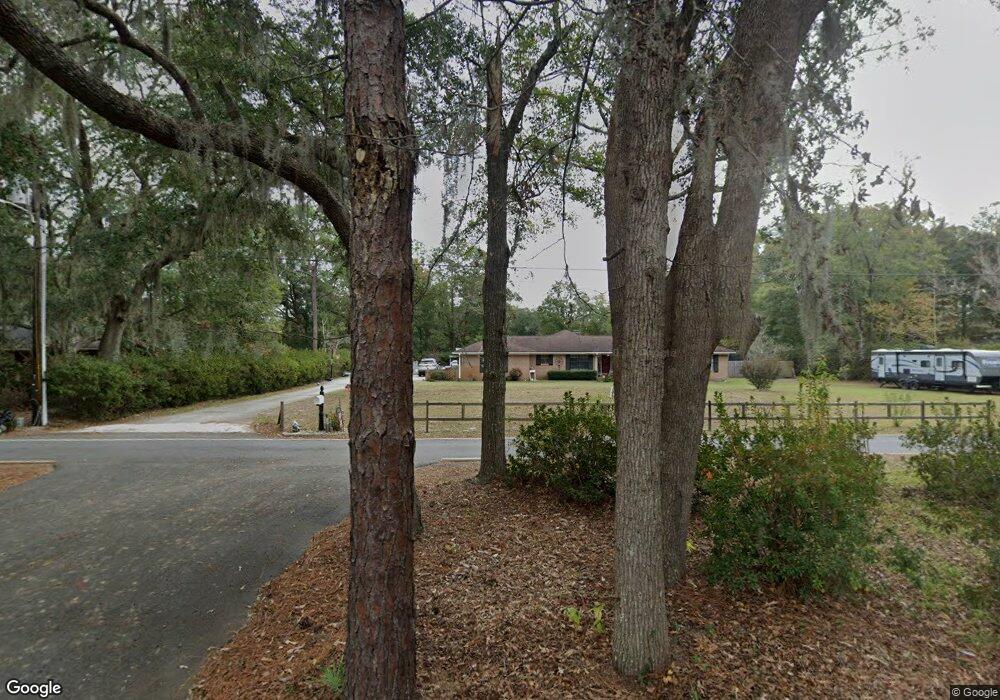
816 Bradwell St Unit n/a Hinesville, GA 31313
Estimated Value: $257,891 - $348,000
3
Beds
2
Baths
1,960
Sq Ft
$149/Sq Ft
Est. Value
About This Home
This home is located at 816 Bradwell St Unit n/a, Hinesville, GA 31313 and is currently estimated at $291,473, approximately $148 per square foot. 816 Bradwell St Unit n/a is a home located in Liberty County with nearby schools including Joseph Martin Elementary School, Snelson-Golden Middle School, and Liberty County High School.
Ownership History
Date
Name
Owned For
Owner Type
Purchase Details
Closed on
Dec 12, 2017
Sold by
Muise Andrew
Bought by
Forsythe Jude T and Forsythe Felicity A
Current Estimated Value
Home Financials for this Owner
Home Financials are based on the most recent Mortgage that was taken out on this home.
Original Mortgage
$120,800
Outstanding Balance
$101,729
Interest Rate
3.95%
Mortgage Type
New Conventional
Estimated Equity
$189,744
Purchase Details
Closed on
Aug 30, 2013
Sold by
Underwood Charles L
Bought by
Muise Andrew
Home Financials for this Owner
Home Financials are based on the most recent Mortgage that was taken out on this home.
Original Mortgage
$143,010
Interest Rate
4.37%
Mortgage Type
VA
Purchase Details
Closed on
May 16, 2013
Sold by
Underwood Charles L
Bought by
Underwood Charles L
Purchase Details
Closed on
Jan 9, 2013
Sold by
Underwood Charles L
Bought by
Underwood Norma Jean
Purchase Details
Closed on
Feb 14, 1975
Bought by
Underwood Charles
Create a Home Valuation Report for This Property
The Home Valuation Report is an in-depth analysis detailing your home's value as well as a comparison with similar homes in the area
Home Values in the Area
Average Home Value in this Area
Purchase History
| Date | Buyer | Sale Price | Title Company |
|---|---|---|---|
| Forsythe Jude T | $151,000 | -- | |
| Muise Andrew | $140,000 | -- | |
| Underwood Charles L | -- | -- | |
| Underwood Norma Jean | -- | -- | |
| Underwood Charles | $4,300 | -- |
Source: Public Records
Mortgage History
| Date | Status | Borrower | Loan Amount |
|---|---|---|---|
| Open | Forsythe Jude T | $120,800 | |
| Previous Owner | Muise Andrew | $143,010 |
Source: Public Records
Tax History Compared to Growth
Tax History
| Year | Tax Paid | Tax Assessment Tax Assessment Total Assessment is a certain percentage of the fair market value that is determined by local assessors to be the total taxable value of land and additions on the property. | Land | Improvement |
|---|---|---|---|---|
| 2024 | $3,723 | $75,794 | $16,000 | $59,794 |
| 2023 | $3,723 | $63,914 | $16,000 | $47,914 |
| 2022 | $2,574 | $55,256 | $16,000 | $39,256 |
| 2021 | $2,455 | $51,710 | $16,000 | $35,710 |
| 2020 | $2,503 | $52,253 | $16,000 | $36,253 |
| 2019 | $2,510 | $52,797 | $16,000 | $36,797 |
| 2018 | $2,522 | $53,340 | $16,000 | $37,340 |
| 2017 | $1,774 | $53,884 | $16,000 | $37,884 |
| 2016 | $2,451 | $54,427 | $16,000 | $38,427 |
| 2015 | $2,549 | $54,427 | $16,000 | $38,427 |
| 2014 | $2,549 | $60,581 | $20,000 | $40,581 |
| 2013 | -- | $58,144 | $20,000 | $38,144 |
Source: Public Records
Map
Nearby Homes
- 830 Bradwell St
- 301 Lakeview Dr
- 822 Lakeview Ct
- 812 Spanish Oak Dr
- 910 Kings Rd
- 804 Barrington Dr
- 0 General Stewart Way
- 604 Caroline St
- 108 W General Stewart Way
- 0 E General Stewart Way
- 411 Woodland Dr
- 103 Stewart Terrace
- 205 Wilson Ave
- 24 Sherwood Dr
- 173 Ironwood Dr
- 1.76 AC Tranquill Way
- 825 Sagewood Dr
- 1.76 AC Shyam Dr
- 215 Collins Ln
- 215 Collins Ln Unit A
- 816 Bradwell St
- 822 Bradwell St
- 808 Bradwell St
- 805 Kings Rd
- 811 Bradwell St
- 815 Bradwell St
- 807 Kings Rd
- 807 Bradwell St
- 823 Bradwell St
- 803 Kings Rd
- 810 Lakeview Ct
- 814 Lakeview Ct
- 809 Kings Rd
- 801 Bradwell St
- 829 Bradwell St
- 806 Lakeview Ct
- 820 Lakeview Ct
- 801 Kings Rd
- 838 Bradwell St
- 802 Lakeview Ct